

Table of Contents
Why Core Web Vitals Matter for Developers
Core Web Vitals have shifted from a "nice-to-have" optimization to a critical ranking factor that directly impacts your website's search visibility and user engagement. As a CTO, developer, or digital strategist, understanding and implementing these metrics isn't just about SEO it's about building websites that users actually want to use.
Google's research consistently shows that websites with poor Core Web Vitals experience higher bounce rates, lower conversion rates, and reduced user engagement. For development teams managing complex applications and CTOs responsible for organisational digital strategy, this translates directly to business impact.
This comprehensive guide walks you through the technical implementation of Core Web Vitals fixes with practical code examples, performance strategies, and actionable roadmaps tailored for developers and technical teams.
Understanding Core Web Vitals: The Technical Breakdown
What Are Core Web Vitals?
Core Web Vitals are three key metrics that Google uses to measure website user experience and performance. These metrics have become ranking factors in Google's search algorithm, making them critical for any digital strategy.
The Three Metrics:
- Largest Contentful Paint (LCP) - Measures loading performance
- First Input Delay (FID) - Measures interactivity responsiveness
- Cumulative Layout Shift (CLS) - Measures visual stability
For developers, these metrics represent concrete optimization targets. For CTOs and engineering managers, they're measurable KPIs that directly impact organisational success.
Largest Contentful Paint (LCP) Optimization
LCP measures when the largest element on the page becomes visible to the user. This is critical because users perceive page "loading" as the moment when main content appears.
LCP Performance Thresholds:
- Good: 0-2.5 seconds (Green zone)
- Needs Improvement: 2.5-4 seconds (Yellow zone)
- Poor: Above 4 seconds (Red zone)
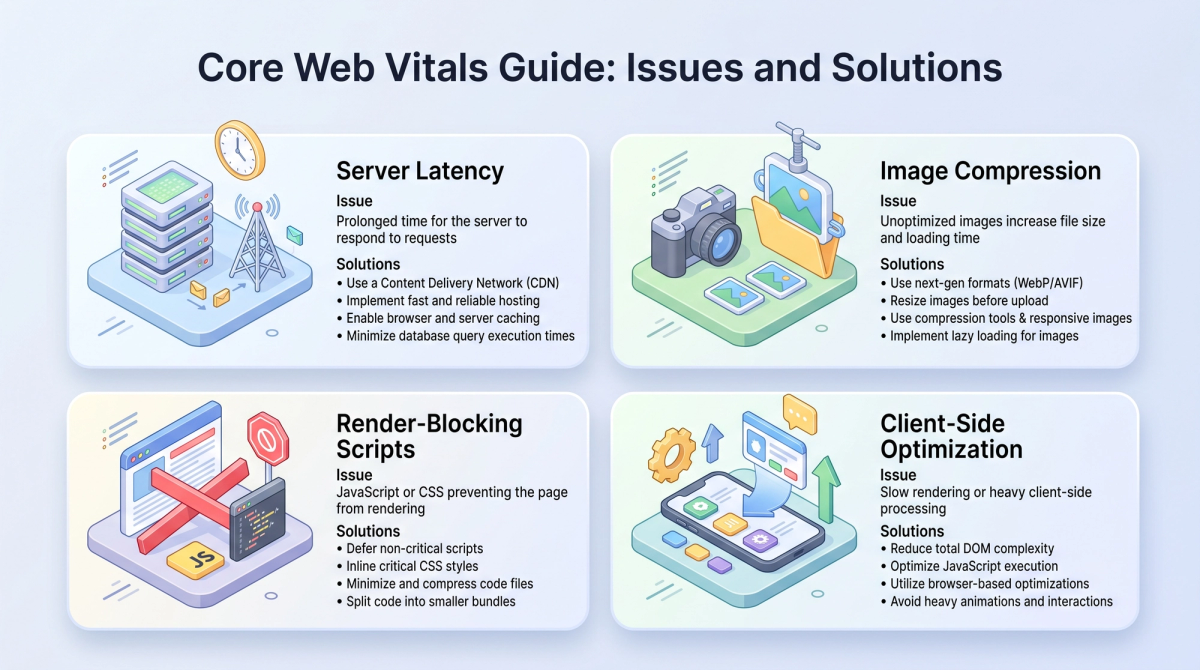
Root Causes of Poor LCP
1. Slow Server Response Time (TTFB)
- Inefficient backend code
- Lack of caching strategies
- Unoptimized database queries
- Inadequate server infrastructure
2. Large Unoptimized Images
- Missing modern formats (WebP)
- No responsive image implementation
- Uncompressed image files
- Oversized dimensions for display size
3. Render-Blocking Resources
- Synchronous JavaScript loading
- Unoptimized CSS files
- Third-party scripts blocking rendering
- Unoptimized web fonts
4. Client-Side Rendering Issues
- Heavy JavaScript frameworks
- Inefficient React/Vue rendering
- Missing code splitting
- Inadequate performance budgets
Technical Solutions for LCP
1. Reduce Server Response Time (TTFB)
Implement server-side optimizations:
// Node.js/Express example - Enable caching headers
app.use((req, res, next) => {
  res.set('Cache-Control', 'public, max-age=3600');
  next();
});

// Optimize database queries
// Instead of: SELECT * FROM users WHERE active = true
// Use: SELECT id, name, email FROM users WHERE active = true

// Implement Redis caching for frequently accessed data
const redis = require('redis');
const client = redis.createClient();

app.get('/api/products', async (req, res) => {
  const cached = await client.get('products_list');
  if (cached) return res.json(JSON.parse(cached));

  const products = await db.query('SELECT * FROM products');
  client.setex('products_list', 3600, JSON.stringify(products));
  res.json(products);
});
2. Implement Image Optimization
Use modern image formats and responsive images:
<!-- Use <picture> element for responsive images with modern formats -->
<picture>
  <source
    srcset="image-small.webp 480w, image-medium.webp 768w, image-large.webp 1200w"
    type="image/webp"
    media="(max-width: 1200px)"
  />
  <source
    srcset="image-small.jpg 480w, image-medium.jpg 768w, image-large.jpg 1200w"
    type="image/jpeg"
  />
  <img
    src="image-large.jpg"
    alt="Product showcase"
    loading="lazy"
    width="1200"
    height="600"
  />
</picture>
3. Implement Critical CSS Inline
<head>
  <!-- Inline critical CSS for above-the-fold content -->
  <style>
    /* Critical styles for hero section - keeps <20KB */
    .hero { background: linear-gradient(135deg, #667eea 0%, #764ba2 100%); }
    .hero h1 { font-size: 2.5rem; color: white; margin: 0; }
    .hero p { font-size: 1.2rem; color: rgba(255,255,255,0.9); }
  </style>

  <!-- Defer non-critical CSS -->
  <link rel="preload" href="/styles/non-critical.css" as="style"
    onload="this.onload=null;this.rel='stylesheet'" />
  <noscript>
    <link rel="stylesheet" href="/styles/non-critical.css" />
  </noscript>
</head>
4. Defer and Async JavaScript
<!-- Defer non-critical JavaScript -->
<script src="/analytics.js" defer></script>
<script src="/tracking.js" async></script>

<!-- For Next.js applications - automatic code splitting -->
// next.config.js
module.exports = {
  swcMinify: true, // SWC minifier faster than Terser
  compress: {
    level: 9,
  },
  experimental: {
    optimizePackageImports: [
      "@chakra-ui/react",
      "lodash",
      "lodash-es",
    ],
  },
};
First Input Delay (FID): Responsiveness Optimization
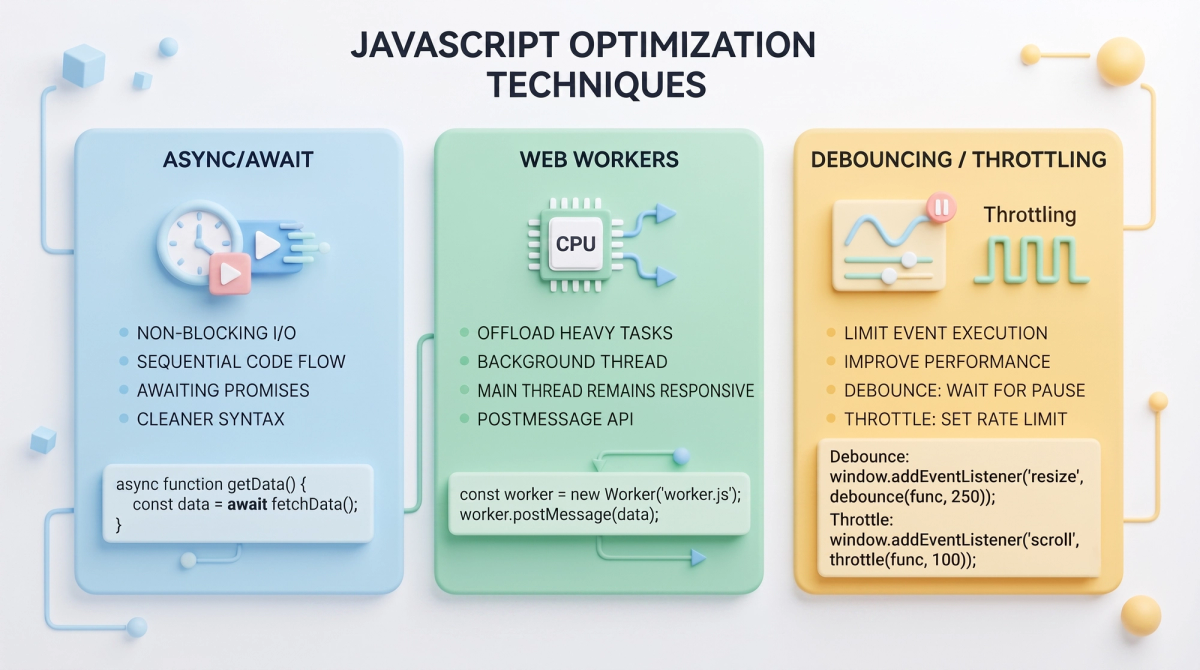
FID measures the delay between user interaction and browser response. This metric is especially important for interactive applications and SaaS platforms.
FID Performance Thresholds:
- Good: 0-100 milliseconds
- Needs Improvement: 100-300 milliseconds
- Poor: Above 300 milliseconds
Technical Causes of Poor FID
1. Long Main Thread Tasks (>50ms)
- Heavy computation on main thread
- Large JavaScript bundles
- Inefficient rendering calculations
- Blocking operations
2. Third-Party Script Impact
- Analytics scripts
- Advertising platforms
- Chat widgets
- Unoptimized vendor libraries
3. Inefficient Event Handlers
- Complex calculations in handlers
- Missing debounce/throttle
- Layout thrashing
- Frequent repaints/reflows
Solutions for FID Optimization
1. Break Up Long Tasks
// Bad: Single long task blocks main thread
function processLargeDataset(data) {
  const results = data.map(item => {
    // 50ms+ computation per item
    return complexCalculation(item);
  });
  return results;
}

// Good: Break into smaller chunks
function* processLargeDatasetGenerator(data) {
  for (const item of data) {
    yield complexCalculation(item);
  }
}

async function processWithYield(data) {
  const results = [];
  for (const item of processLargeDatasetGenerator(data)) {
    results.push(item);
    // Yield control back to browser
    await new Promise(resolve => setTimeout(resolve, 0));
  }
  return results;
}
2. Use Web Workers for Heavy Processing
// main.js
const worker = new Worker('expensive-calculation.worker.js');

function processData(largeDataset) {
  worker.postMessage({ data: largeDataset });
}

worker.onmessage = function(event) {
  console.log('Processing complete:', event.data);
  updateUI(event.data);
};

// expensive-calculation.worker.js
self.onmessage = function(event) {
  const results = event.data.data.map(item => {
    // Heavy computation happens off main thread
    return complexMachineLearningCalculation(item);
  });
  self.postMessage(results);
};
3. Optimize Third-Party Scripts
<!-- Load third-party scripts with intentional delay -->
<script>
  // Defer non-critical third-party scripts
  if (navigator.connection?.saveData !== true) {
    const script = document.createElement('script');
    script.src = 'analytics-provider.js';
    script.async = true;
    // Load after page is interactive
    window.addEventListener('load', () => {
      document.body.appendChild(script);
    });
  }
</script>

<!-- Use facade pattern for widgets -->
<div id="chat-widget-placeholder"></div>
<script>
  // Load chat widget only on user interaction
  document.getElementById('chat-widget-placeholder').addEventListener('click', () => {
    const script = document.createElement('script');
    script.src = 'chat-widget.js';
    document.body.appendChild(script);
  });
</script>
4. Implement Debouncing and Throttling
// Debounce: Fire after user stops interacting
function debounce(func, wait) {
  let timeout;
  return function executedFunction(...args) {
    const later = () => {
      clearTimeout(timeout);
      func(...args);
    };
    clearTimeout(timeout);
    timeout = setTimeout(later, wait);
  };
}

// Throttle: Fire at most once per interval
function throttle(func, limit) {
  let inThrottle;
  return function(...args) {
    if (!inThrottle) {
      func.apply(this, args);
      inThrottle = true;
      setTimeout(() => inThrottle = false, limit);
    }
  };
}

// Usage examples
const handleSearch = debounce(function(query) {
  performSearch(query); // Called after user stops typing
}, 300);

const handleScroll = throttle(function() {
  updateScrollPosition(); // Called max once per 100ms
}, 100);

window.addEventListener('input', handleSearch);
window.addEventListener('scroll', handleScroll);
Cumulative Layout Shift (CLS): Visual Stability
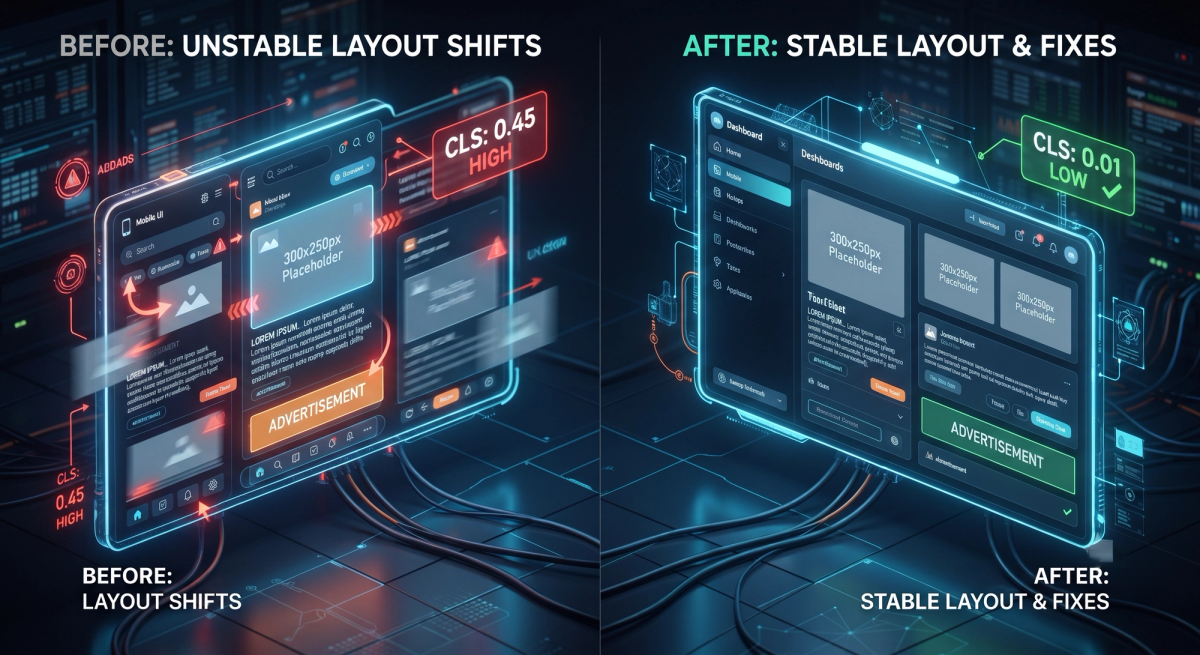
CLS measures unexpected layout shifts during page load and interaction. This metric is often overlooked but crucial for user satisfaction.
CLS Performance Thresholds:
- Good: 0-0.1
- Needs Improvement: 0.1-0.25
- Poor: Above 0.25
Technical Root Causes
1. Unsized Images and Videos
- Missing width/height attributes
- No aspect ratio definition
- Responsive images without dimensions
- Lazy-loaded images without placeholders
2. Dynamically Injected Content
- Ads loading after content
- Banners appearing unexpectedly
- Cookie notices injecting above fold
- Dynamic recommendation widgets
3. Font Loading Issues
- Web fonts causing text reflow
- System font fallbacks with different metrics
- Missing font-display strategy
- Insufficient font-family fallbacks
4. Animations and Transforms
- Position changes instead of transforms
- Margin/padding changes during animation
- Position: absolute elements affecting layout
- Float-based layouts
CLS Optimization Solutions
1. Properly Size Media Elements
<!-- Bad: No dimensions specified -->
<img src="product.jpg" alt="Product" />

<!-- Good: Explicit width and height -->
<img src="product.jpg" alt="Product" width="1200" height="600" />

<!-- Best: Using aspect-ratio CSS -->
<img
  src="product.jpg"
  alt="Product"
  style="width: 100%; max-width: 1200px; aspect-ratio: 16/9;"
  loading="lazy"
/>

<!-- Video with reserved space -->
<div style="position: relative; width: 100%; padding-bottom: 56.25%;">
  <iframe
    style="position: absolute; top: 0; left: 0; width: 100%; height: 100%;"
    src="https://www.youtube.com/embed/video-id"
  />
</div>
2. Optimize Font Loading
@font-face {
  font-family: 'CustomFont';
  src: url('/fonts/custom-font.woff2') format('woff2');
  /* font-display: auto; (default, worst for CLS) */
  /* font-display: block; (invisible until loaded) */
  font-display: swap;  /* Show fallback immediately */
  /* font-display: fallback; (show fallback for ~3s) */
  /* font-display: optional; (use fallback if timeout) */
  font-weight: 400;
  font-style: normal;
  font-stretch: 100%;
}

/* Use system font stack as fallback */
body {
  font-family: 'CustomFont', -apple-system, BlinkMacSystemFont, 'Segoe UI', Roboto, sans-serif;
}

/* Adjust fallback metrics to match web font */
.heading {
  font-family: 'CustomFont', Georgia, serif;
  line-height: 1.3;
  font-size: 2rem;
}
3. Reserve Space for Ads and Dynamic Content
<!-- Reserve space for ad with min-height -->
<div style="min-height: 250px; margin: 1rem 0;">
  <!-- Ad will load here without shifting content -->
  <div id="ad-container"></div>
</div>

<!-- Cookie banner with reserved space -->
<div id="cookie-banner" style="
  position: fixed;
  bottom: 0;
  left: 0;
  right: 0;
  background: white;
  padding: 1rem;
  box-shadow: 0 -2px 10px rgba(0,0,0,0.1);
  z-index: 9999;
  transform: translateY(100%);
  transition: transform 0.3s ease;
">
  <!-- Banner content -->
</div>

<!-- Add margin-bottom to body when banner shows -->
<style>
  body.cookie-banner-visible {
    margin-bottom: 100px;
  }
</style>
4. Use CSS Transforms for Animations (Not Position Changes)
/* Bad: Causes layout shift */
button:hover {
  top: 5px;  /* Changes layout */
  left: 10px; /* Recalculates everything */
}

/* Good: No layout recalculation */
button:hover {
  transform: translateY(-5px) translateX(10px);
  transition: transform 0.2s ease;
}

/* Efficient animation using will-change */
.animated-element {
  will-change: transform, opacity;
  transform: translateZ(0); /* Enable hardware acceleration */
}

.animated-element.animate {
  animation: slide-in 0.3s ease forwards;
}

@keyframes slide-in {
  from {
    opacity: 0;
    transform: translateX(-100px);
  }
  to {
    opacity: 1;
    transform: translateX(0);
  }
}
Performance Monitoring and Measurement Tools
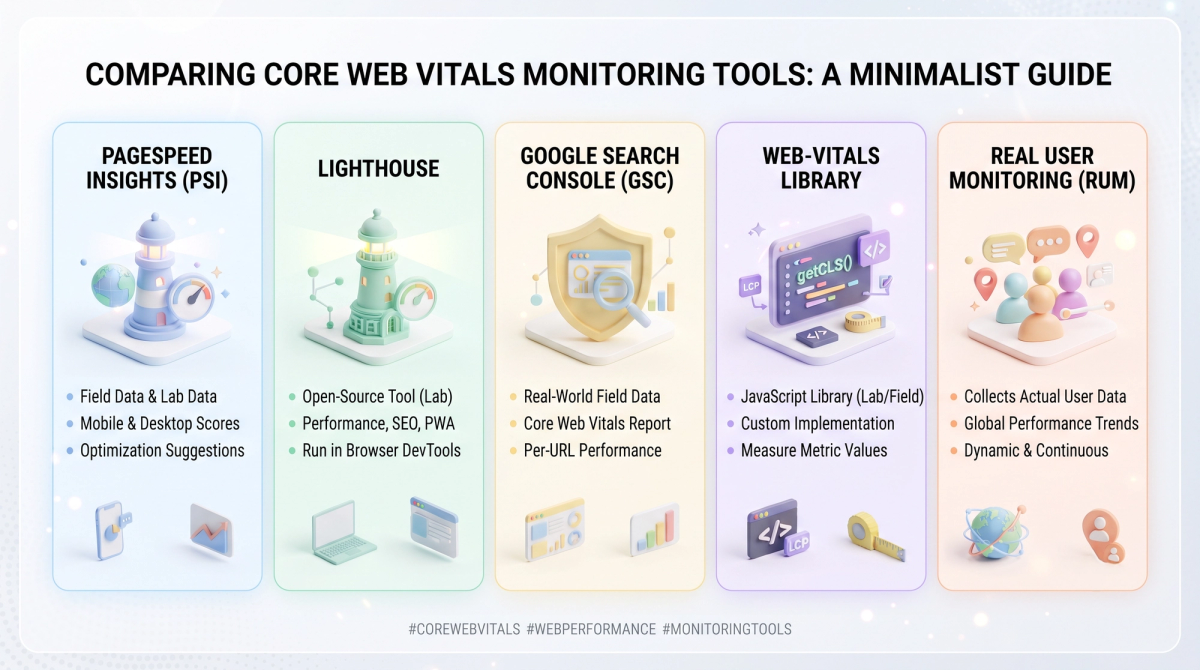
Essential Tools for Core Web Vitals Monitoring
1. Google PageSpeed Insights
- Provides field data from real users
- Shows lab data from Chrome
- Offers specific optimization recommendations
- Free and unlimited
# Using API for automation
curl "https://www.googleapis.com/pagespeedonline/v5/runPagespeed?url=yoursite.com&key=YOUR_API_KEY"
2. Chrome DevTools Lighthouse
- Run locally for instant feedback
- Detailed performance audits
- Compare before/after optimizations
- Perfect for development workflow
3. WebVitals JavaScript Library
import { getCLS, getFID, getFCP, getLCP, getTTFB } from 'web-vitals';

getCLS(console.log); // Log CLS score
getFID(console.log); // Log FID score
getLCP(console.log); // Log LCP score

// Send to analytics for tracking
function sendToAnalytics(metric) {
  if (navigator.sendBeacon) {
    const body = JSON.stringify(metric);
    navigator.sendBeacon('/analytics', body);
  }
}

getCLS(sendToAnalytics);
getFID(sendToAnalytics);
getLCP(sendToAnalytics);
4. Google Search Console Core Web Vitals Report
- View performance across your entire site
- Identify pages with issues
- Track improvements over time
- Segment by device and geography
5. Real User Monitoring (RUM) Tools
- New Relic
- Datadog
- Firebase Performance Monitoring
- Sentry
- Custom RUM implementation
8-Week Implementation Roadmap
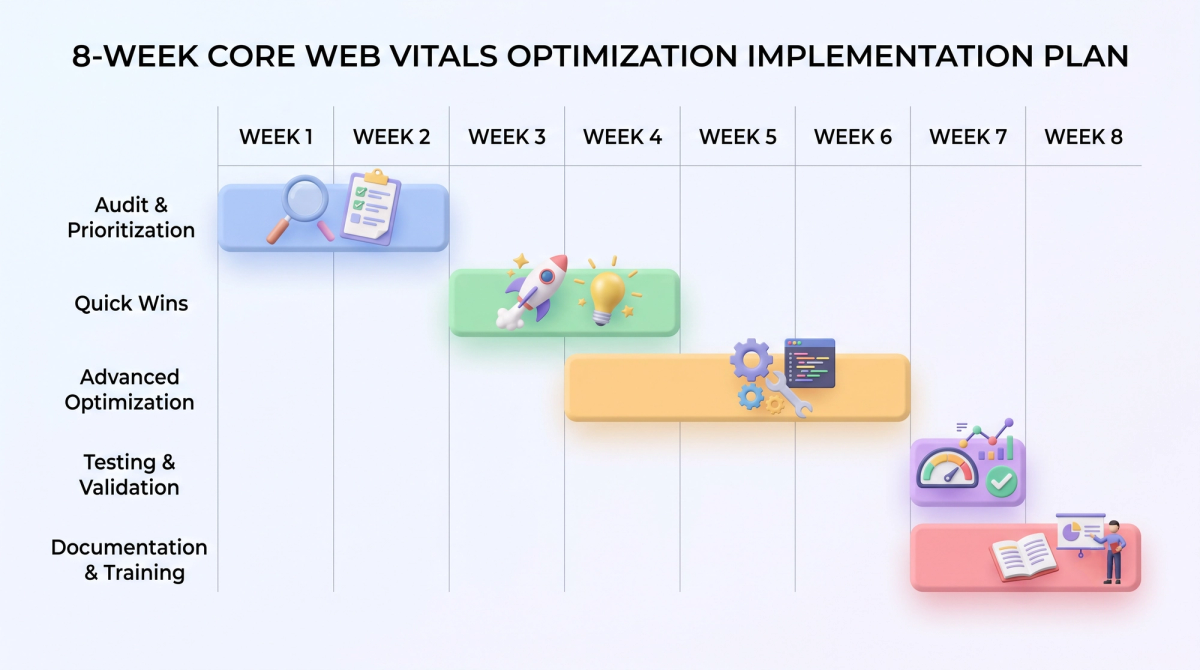
Week 1-2: Audit & Prioritization
- Run PageSpeed Insights on 50+ key pages
- Identify patterns in issues (images, scripts, fonts)
- Measure current Core Web Vitals with WebVitals library
- Set improvement targets
- Our SEO team can audit your technical foundation
Week 3-4: Quick Wins
- Implement image optimization (compress, WebP)
- Add lazy loading to below-fold images
- Implement critical CSS inlining
- Defer non-critical JavaScript
- Add width/height to all images
- Expected LCP improvement: 15-30%
Week 5-6: Advanced Optimization
- Implement Web Workers for heavy computation
- Optimize third-party scripts
- Implement font-display swap
- Add resource hints (preconnect, prefetch)
- Optimize server response time
- Expected improvement: Additional 20-30% better metrics
Week 7: Testing & Validation
- A/B test changes
- Monitor real user metrics
- Check for regressions
- Validate cross-browser compatibility
- Performance test on low-end devices
Week 8: Documentation & Team Training
- Document optimization techniques used
- Create developer guidelines
- Train team on performance budgets
- Set up monitoring dashboards
- Plan ongoing optimization cycle
Real-World Implementation Examples
E-Commerce Platform Case Study
A developer team managing a Shopify-based e-commerce store improved:
- LCP: 4.2s → 1.8s (57% improvement)
- FID: 180ms → 45ms (75% improvement)
- CLS: 0.18 → 0.05 (72% improvement)
Key changes:
- Optimized product images with WebP
- Implemented critical CSS
- Deferred third-party analytics
- Added lazy loading for below-fold products
SaaS Application Optimization
A developer team optimizing a React-based SaaS application:
- LCP: 3.5s → 1.2s (66% improvement)
- FID: 250ms → 60ms (76% improvement)
- CLS: 0.22 → 0.06 (73% improvement)
Key changes:
- Code splitting by route
- Implemented Web Workers for data processing
- Optimized bundle size (removed unused dependencies)
- Implemented dynamic imports for features
Performance Budgets and Continuous Monitoring
Setting Performance Budgets
// lighthouse.config.js
module.exports = {
  ci: {
    collect: {
      url: ['https://yoursite.com'],
      numberOfRuns: 3,
    },
    assert: {
      preset: 'lighthouse:recommended',
      assertions: {
        'categories:performance': ['error', { minScore: 0.9 }],
        'metrics:largest-contentful-paint': ['error', { maxNumericValue: 2500 }],
        'metrics:first-input-delay': ['error', { maxNumericValue: 100 }],
        'metrics:cumulative-layout-shift': ['error', { maxNumericValue: 0.1 }],
      }
    },
    upload: {
      target: 'temporary-public-storage',
    },
  },
};
Learn how to improve overall web development strategy with performance-first approach
Common Pitfalls and How to Avoid Them
1. Focusing Only on Lab Data
Problem: PageSpeed Insights shows good scores but real users experience poor performance
Solution: Use WebVitals library to monitor real user metrics. Compare field data with lab data weekly.
2. Over-Optimization
Problem: Implementing excessive optimizations that hurt maintainability
Solution: Focus on 80/20 rule - 20% of optimizations will yield 80% of performance gains. Get professional guidance from performance experts
3. Ignoring Third-Party Impact
Problem: Third-party scripts (ads, analytics) degrade performance
Solution: Regularly audit third-party scripts. Use facades for non-critical services.
4. Inadequate Testing
Problem: Performance improvements on developer machine but not in production
Solution: Test on real devices, low-end devices, and slow network conditions (throttle to 4G).
5. Missing Team Buy-In
Problem: Performance optimization treated as one-off project, not continuous practice
Solution: Set organization-wide performance budgets. Automate performance testing in CI/CD pipeline.
Core Web Vitals and Business Impact
Performance improvements directly impact:
- SEO Rankings: Better visibility in search results
- Conversion Rates: 1 second delay = 7% conversion loss
- Bounce Rate: Faster pages = lower bounce rates
- User Satisfaction: Better performance = happier users
- Mobile Performance: Especially critical for mobile-first indexing
Discover how performance optimization impacts overall digital strategy
Advanced: Performance Testing in CI/CD Pipeline
# GitHub Actions example
name: Performance Tests
on: [pull_request]

jobs:
  lighthouse:
    runs-on: ubuntu-latest
    steps:
      - uses: actions/checkout@v2
      - uses: actions/setup-node@v2
        with:
          node-version: '18'

      - name: Install dependencies
        run: npm install

      - name: Build application
        run: npm run build

      - name: Run Lighthouse CI
        uses: treosh/lighthouse-ci-action@v8
        with:
          uploadArtifacts: true
          temporaryPublicStorage: true
          configPath: './lighthouse.config.js'

      - name: Check performance budgets
        run: npm run test:performance
Best Practices Checklist for Developers
- Measure Core Web Vitals with WebVitals library
- Implement image optimization (WebP, compression)
- Use lazy loading for images and iframes
- Implement critical CSS inlining
- Defer non-critical JavaScript
- Optimize server response time (TTFB)
- Use CDN for static assets
- Implement Web Workers for heavy computation
- Optimize third-party scripts
- Set up continuous monitoring
- Create performance budgets
- Document optimization techniques
- Train team on performance best practices
Resources and Further Learning
- Google Web Vitals Guide
- Chrome DevTools Performance Guide
- WebVitals Library Documentation
- Lighthouse Documentation
- Web Performance Working Group
Making Performance a Core Value
Core Web Vitals optimization isn't just an SEO tactic it's a fundamental practice for building user-centric applications. As a developer or CTO, implementing these optimizations demonstrates commitment to user experience and business outcomes.
The 8-week roadmap provides a structured approach, but successful implementation requires:
- Team Alignment: Make performance a shared responsibility
- Continuous Monitoring: Track metrics weekly, not monthly
- Iteration: Performance optimization is never truly "done"
- User-Centric Thinking: Always ask "how does this impact users?"
Ready to optimize your web application's performance?
Let's conduct a comprehensive technical audit of your web infrastructure and create a performance roadmap tailored to your team's capacity and business goals.
FAQ: Core Web Vitals for Developers
Q: What's the difference between field and lab data?
A: Lab data (synthetic) is consistent and reproducible in controlled environments. Field data (real user monitoring) shows actual user experience across devices and networks. Both are essential for complete understanding.
Q: How often should we monitor Core Web Vitals?
A: Continuously with RUM tools, weekly reviews of aggregated data, daily checks during development cycle.
Q: Can we improve Core Web Vitals without rewriting our application?
A: Yes. Most improvements come from optimization, not rewriting. Focus on images, scripts, and third-party services first.
Q: Which metric is most important?
A: All three are equally important for ranking. However, LCP typically has the biggest user-visible impact.
Q: How do Core Web Vitals affect mobile differently?
A: Mobile metrics are often worse due to network and device constraints. Optimize specifically for mobile using Network Throttling in DevTools.
Related Resources
Technical SEO Services for Developers and CTOs Web Development Best Practices Performance Optimization Strategies Mobile App Performance
Related Articles
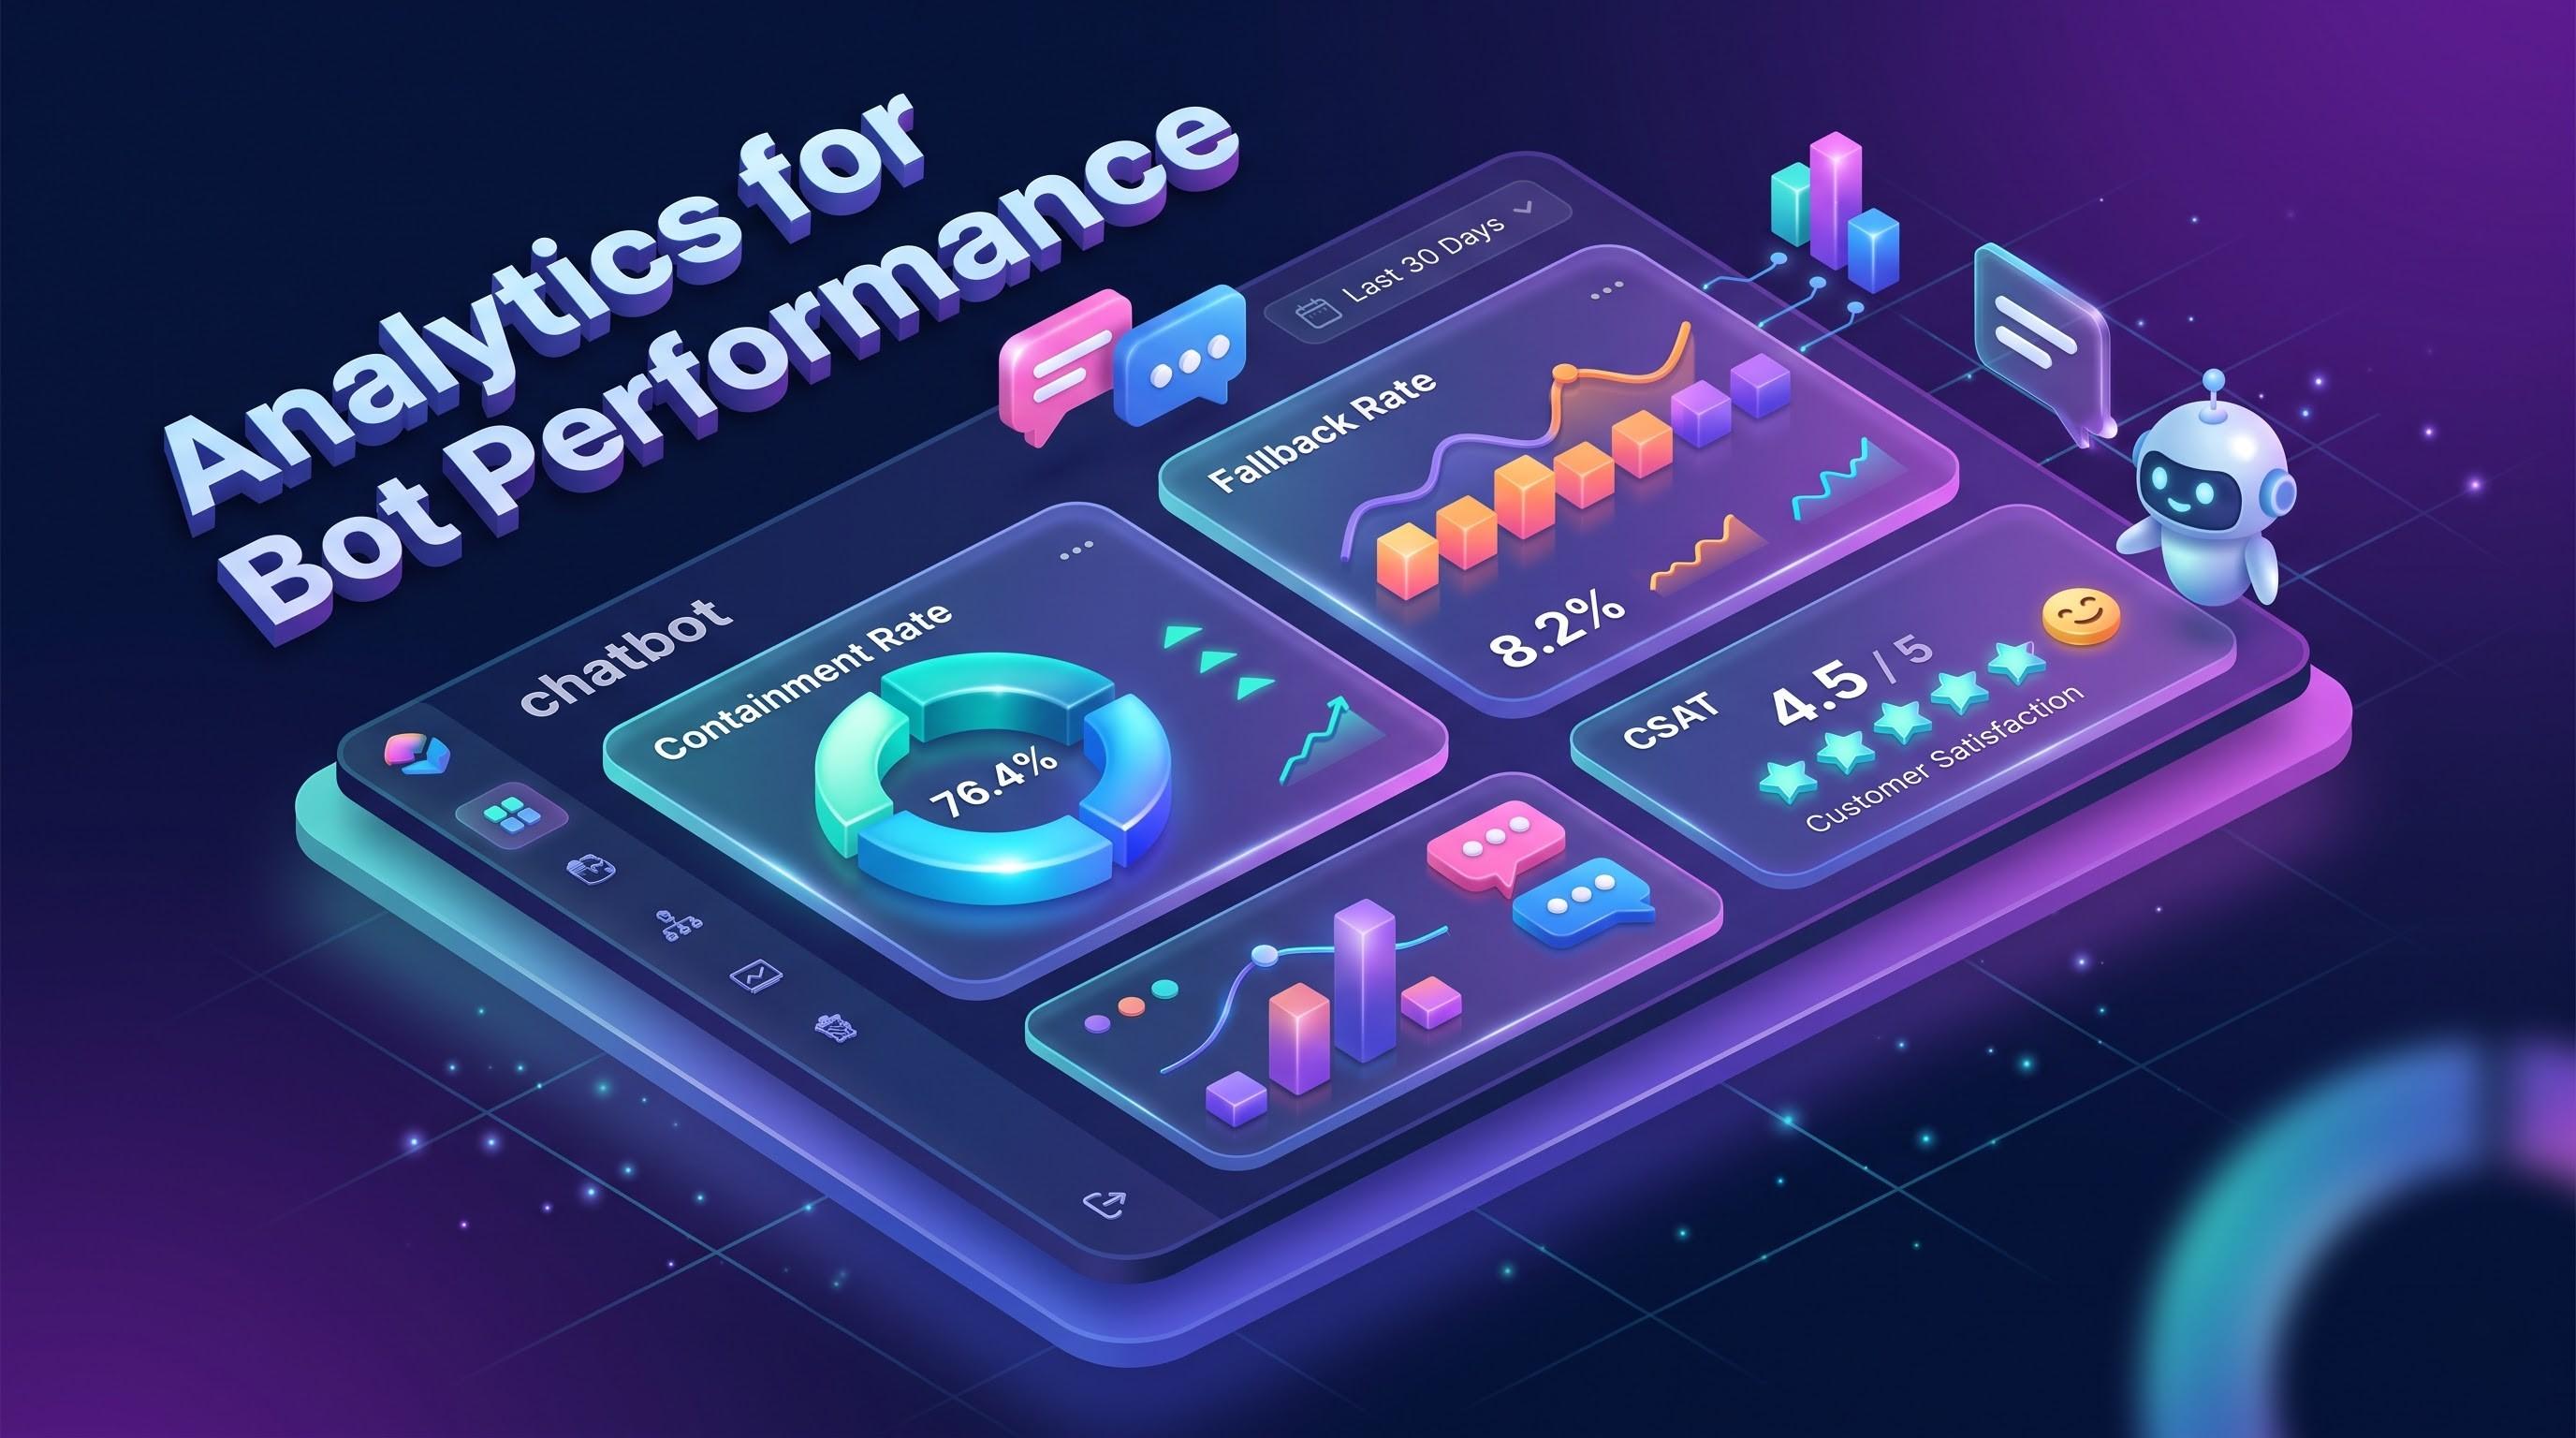
Analytics for Bot Performance: How to Measure, Improve and Prove Your Chatbot's Value
Your chatbot is live, but is it working? This guide explains analytics for bot performance in plain language: the metrics that matter, how to set up tracking, and how to turn conversation data into better answers, lower costs and measurable ROI.
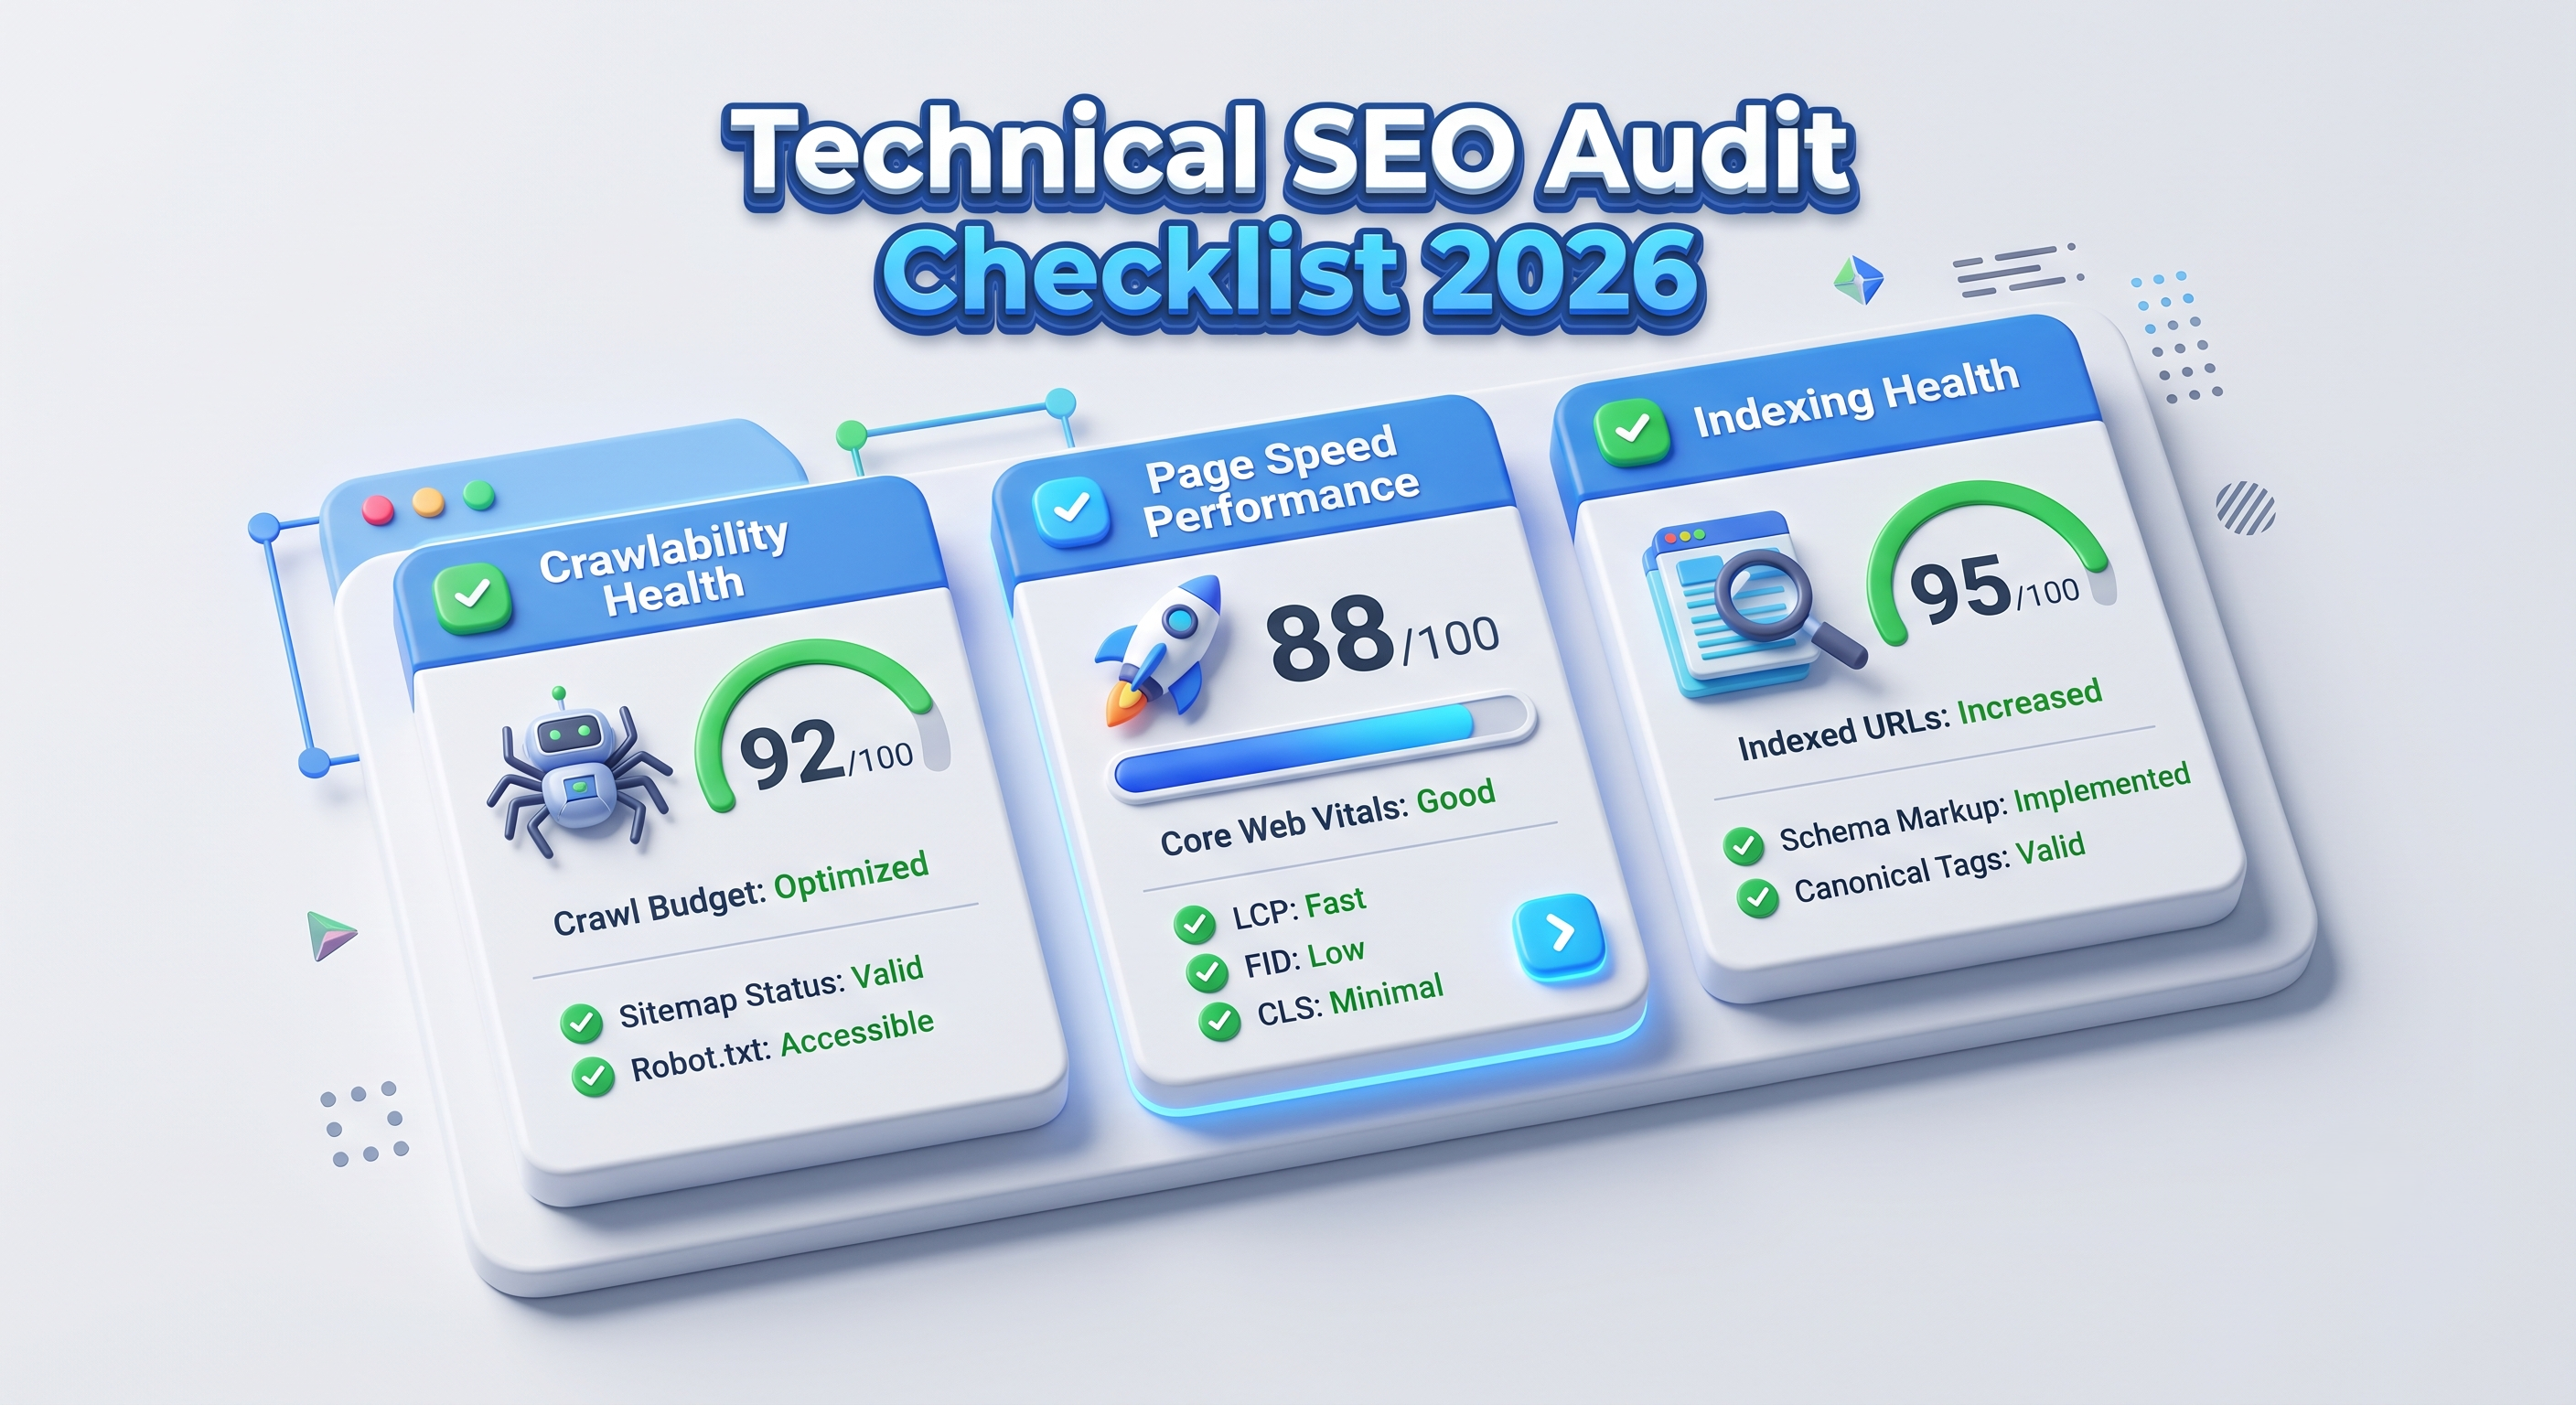
Technical SEO Audit Checklist 2026: The Complete Step-by-Step Guide
A technical SEO audit finds the hidden problems that stop search engines from crawling, rendering and ranking your pages. This 2026 checklist walks developers, testers, CTOs and marketers through every step, from crawlability and Core Web Vitals to structured data and AI search readiness.
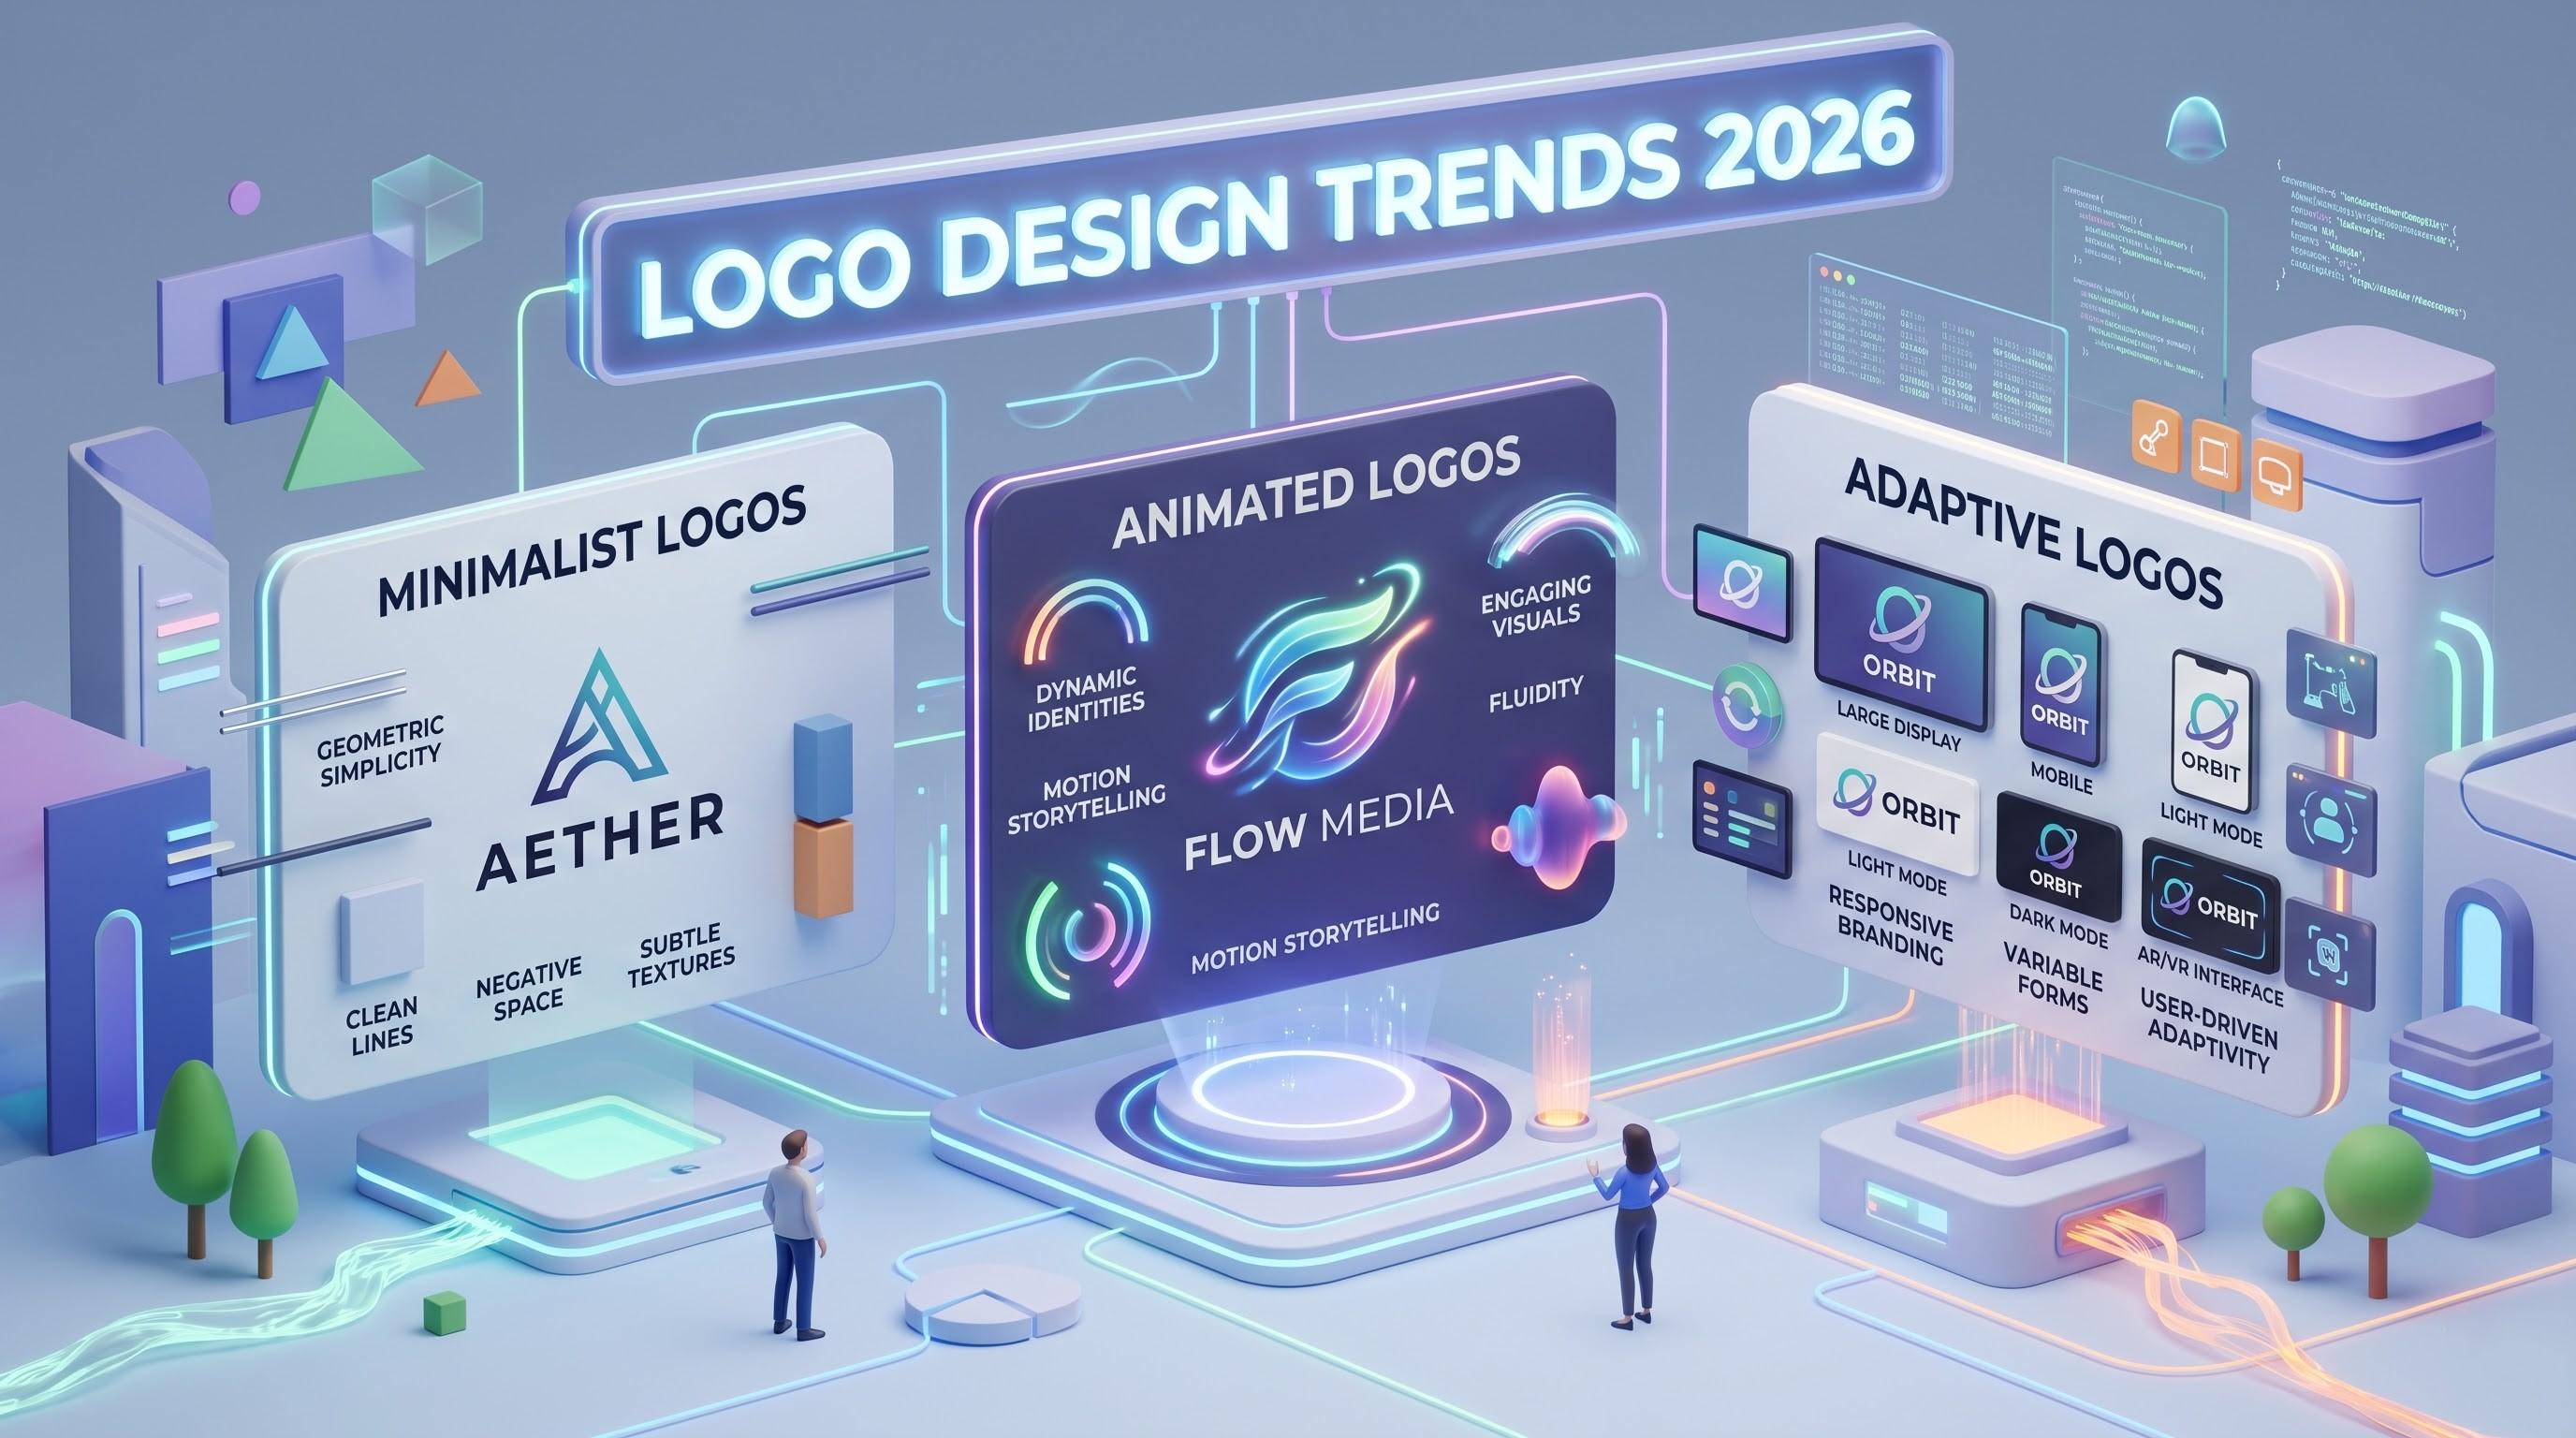
Logo Design Trends 2026: 8 Shifts Every Tech Brand Must Know
Logos now work like small pieces of software. Discover the 8 logo design trends of 2026, from adaptive systems to motion and dark-mode palettes, plus a technical checklist for developers and marketers.