
Table of Contents
Data is only valuable when it leads to better decisions. This guide explores how to effectively collect, analyze, and act on data to improve business outcomes.
Transform Data into Actionable Insights
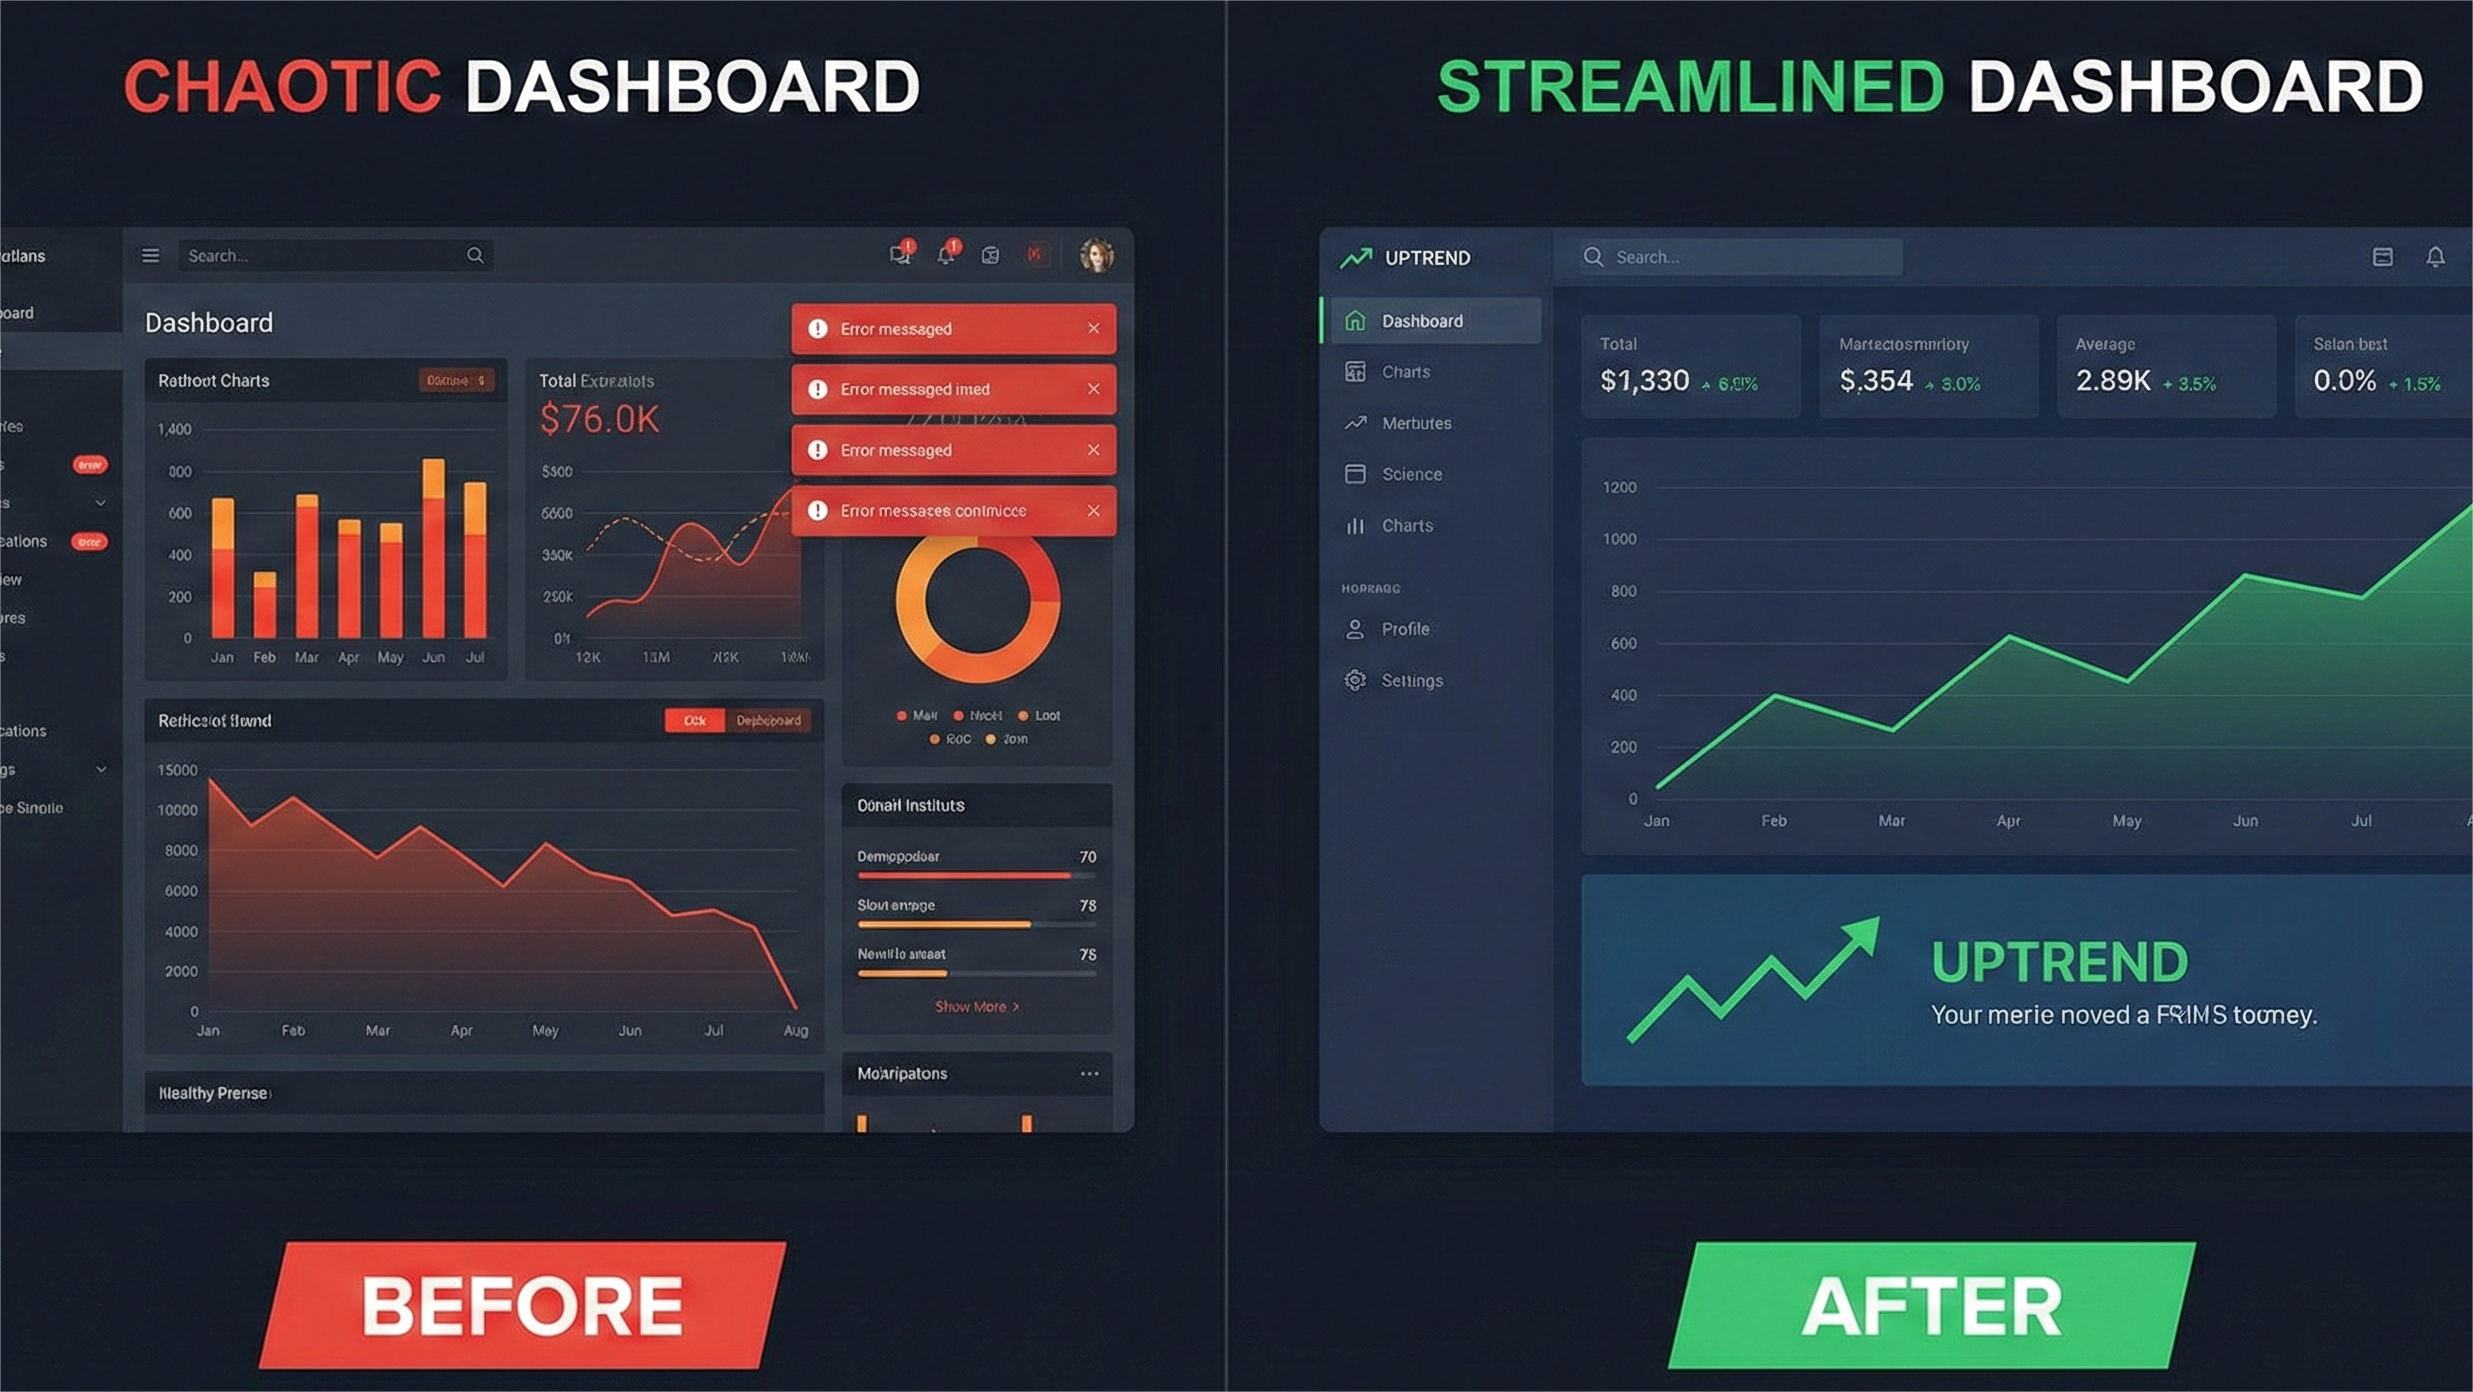
In the modern digital landscape, data is the lifeblood of strategy. However, many businesses suffer from "data obesity"-collecting vast amounts of information without knowing how to trim the fat and find the muscle. To truly transform data, you must move beyond looking at "what happened" and start asking "why it happened" and "what will happen next."
Building a Data-Driven Culture
Creating a culture that respects data starts at the top. It requires a shift from "HiPPO" (Highest Paid Person’s Opinion) decision-making to evidence-based execution.
- Question assumptions: Never take a marketing trend at face value.
- Test hypotheses: Use A/B testing for every major change.
- Measure outcomes: Define what success looks like before you launch.
- Iterate based on data: Failure is just a data point for the next success.
"Without data, you're just another person with an opinion." - W. Edwards Deming

The Strategic Foundation of Analytics
To expand your business, you need a partner that understands the intersection of data and creativity. For instance, our Social Media Marketing Services utilize deep data analytics to ensure every post and ad campaign reaches the exact demographic likely to convert.
Key Analytics Frameworks: The AARRR (Pirate Metrics) Framework
Understanding the lifecycle of a customer is vital. The AARRR framework breaks this down into five manageable stages:
- Acquisition (Top of funnel): How do users find us? Is it through SEO, Social Media Marketing, or referrals?
- Activation (First experience): Do they see value immediately? This is where your UI/UX and messaging must align.
- Retention (Engagement): Do they return? High churn is a silent killer of ROI.
- Revenue (Monetization): How do we earn? Which segments provide the highest Lifetime Value (LTV)?
- Referral: Do users tell others? Viral loops are the cheapest form of growth.
Framework Tip: Start with one metric that matters most to your current growth stage. If you are a startup, focus on Activation. If you are established, focus on Retention.
Deep Dive: Social Media Marketing Analytics
In the realm of Social Media Marketing, data dictates the creative direction. We no longer guess which colors or headlines work; we analyze engagement rates, click-through rates (CTR), and sentiment analysis. By leveraging data, brands can pivot their voice to match the evolving needs of their audience.
If you are looking to elevate your online presence through data-backed strategies, explore our Social Media Marketing Company page to see how we turn social signals into sales.
Essential Analytics Tools
To compete in today's market, you need a robust tech stack. Here are the industry leaders:
- Google Analytics 4: The gold standard for web analytics and event tracking.
- Mixpanel: Deep-dive product analytics to see exactly how users interact with your software.
- Tableau/Power BI: Powerhouses for Business Intelligence and complex data visualization.
- Amplitude: Specialized in tracking user behavior and retention patterns.
Integrating Data with Brand Design
Data doesn't just inform numbers; it informs aesthetics. Brand Design Service is often thought of as purely artistic, but the best brands are built on psychological data. What colors evoke trust? What layout increases readability? Our team at Cinute Infomedia specializes in Brand Design Services that combine visual excellence with conversion rate optimization (CRO) data.
JavaScript
// analytics-track.js // Track custom events to measure specific business goals analytics.track('purchase_completed', { orderId: order.id, value: order.total, items: order.items.length, source: user.acquisitionChannel });
Advanced Section: Predictive Analytics and AI
The future of data is not just descriptive (what happened) but predictive (what will happen). By using machine learning models, businesses can predict customer churn before it happens or identify which leads are most likely to close. This level of sophistication requires a solid web foundation. If your website isn't optimized for data collection, you are losing money. Check out our Web Development Services to ensure your site is built with the latest tracking and performance capabilities.

The Role of SEO in Data Collection
Search Engine Optimization is the ultimate data mine. By analyzing search intent, you can understand exactly what your customers are looking for before they even land on your site. Keywords are not just for ranking; they are insights into human behavior.
To dominate the search engine result pages (SERPs), you need a data-driven SEO strategy. Visit our SEO Services to learn how we use data to drive organic growth and sustainable traffic.
From Analysis to Action
Data is useless if it sits in a spreadsheet. Follow this four-step loop to ensure your data drives results:
- Prioritize by impact: Use the ICE (Impact, Confidence, Ease) framework to decide what to fix first.
- Design experiments: Create a "Control" and a "Variation."
- Implement changes: Deploy the winning variation.
- Measure results: Did the change actually move the North Star Metric?
Content Marketing and Data Synergy
High-quality content is the engine of digital growth. But how do you know what to write? Data-driven content marketing involves looking at "Time on Page," "Scroll Depth," and "Conversion Path." If a blog post gets 10,000 views but zero leads, the data is telling you that your Call to Action (CTA) or your audience targeting is off.
For businesses looking to create content that actually converts, our Content Marketing Services focus on the intersection of storytelling and data analytics.

Common Pitfalls to Avoid
Even the most data-savvy companies can fall into these traps:
- Analysis paralysis: Don't wait for perfect data. Set decision deadlines and move forward with the best information available.
- Correlation vs. Causation: Just because two things happen at the same time doesn't mean one caused the other. Always run controlled experiments.
- Vanity metrics: Likes, followers, and raw page views are "vanity." Focus on "Actionable Metrics" like conversion rate, CAC (Customer Acquisition Cost), and LTV.
Enhancing User Experience (UX) through Data
Your website is your 24/7 salesperson. If the data shows a high bounce rate on your checkout page, your Brand Design or technical performance might be the issue. Data allows us to heat-map user behavior to see where they get stuck.
The Importance of Data Security and Ethics
As we collect more data to fuel our Social Media Marketing and SEO efforts, we must prioritize ethics. Privacy laws like GDPR and CCPA aren't just hurdles; they are opportunities to build trust with your audience. Data-driven growth should never come at the expense of user privacy. Transparent data practices lead to higher brand loyalty and long-term success.
Conclusion: The Path Forward
Effective data analytics is about asking the right questions and taking action. It’s about merging the analytical with the creative-ensuring your Brand Design speaks to the soul while your Social Media Marketing targets the mind.
Important: Data without action is just numbers. Always tie analytics to specific decisions.
By building a data-driven culture, you move from guessing to knowing. You stop "hoping" for growth and start "engineering" it. Whether you are optimizing your SEO, refining your brand identity, or launching a new social campaign, let the data be your North Star.
Ready to transform your business with data-driven digital strategies? Contact Cinute Infomedia today and let's build your measurable success story together.
Related Articles
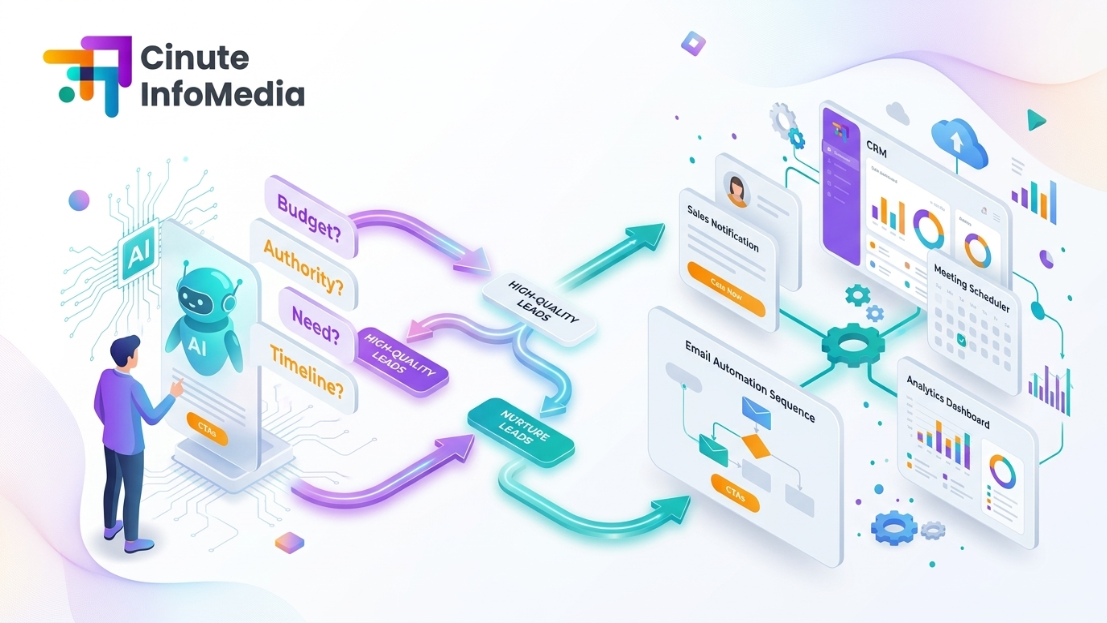
Lead Qualifier Chat Flows: The Complete Guide to AI-Powered Lead Qualification (2026)
Lead qualifier chat flows use AI-powered chatbots to automatically screen, score, and segment your website visitors so your sales team only speaks to prospects who are genuinely ready to buy. This guide covers everything from BANT frameworks to CRM integrations and live chat flow examples.
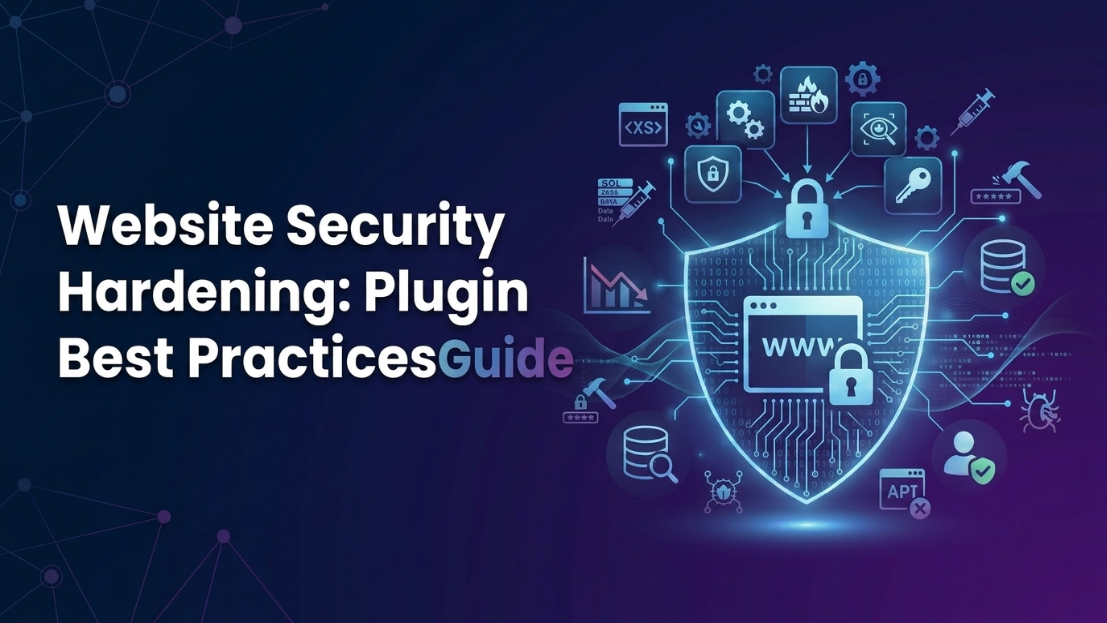
Security Plugins Hardening: The Definitive Website Protection Guide
Simply installing a security plugin will not protect your website if you leave default settings active. Learn how to configure advanced hardening features to safeguard your data, protect user privacy, and prevent unauthorized core file access.

E-commerce Packaging Design: Turning the Unboxing Moment Into Brand Loyalty
Discover how to transform your e-commerce packaging from a simple shipping expense into a powerful customer retention tool. Learn the anatomy of high-converting boxes, the choreography of a memorable unboxing experience, and a sustainable, step-by-step design process that turns first-time buyers into lifelong brand advocates.