Table of Contents
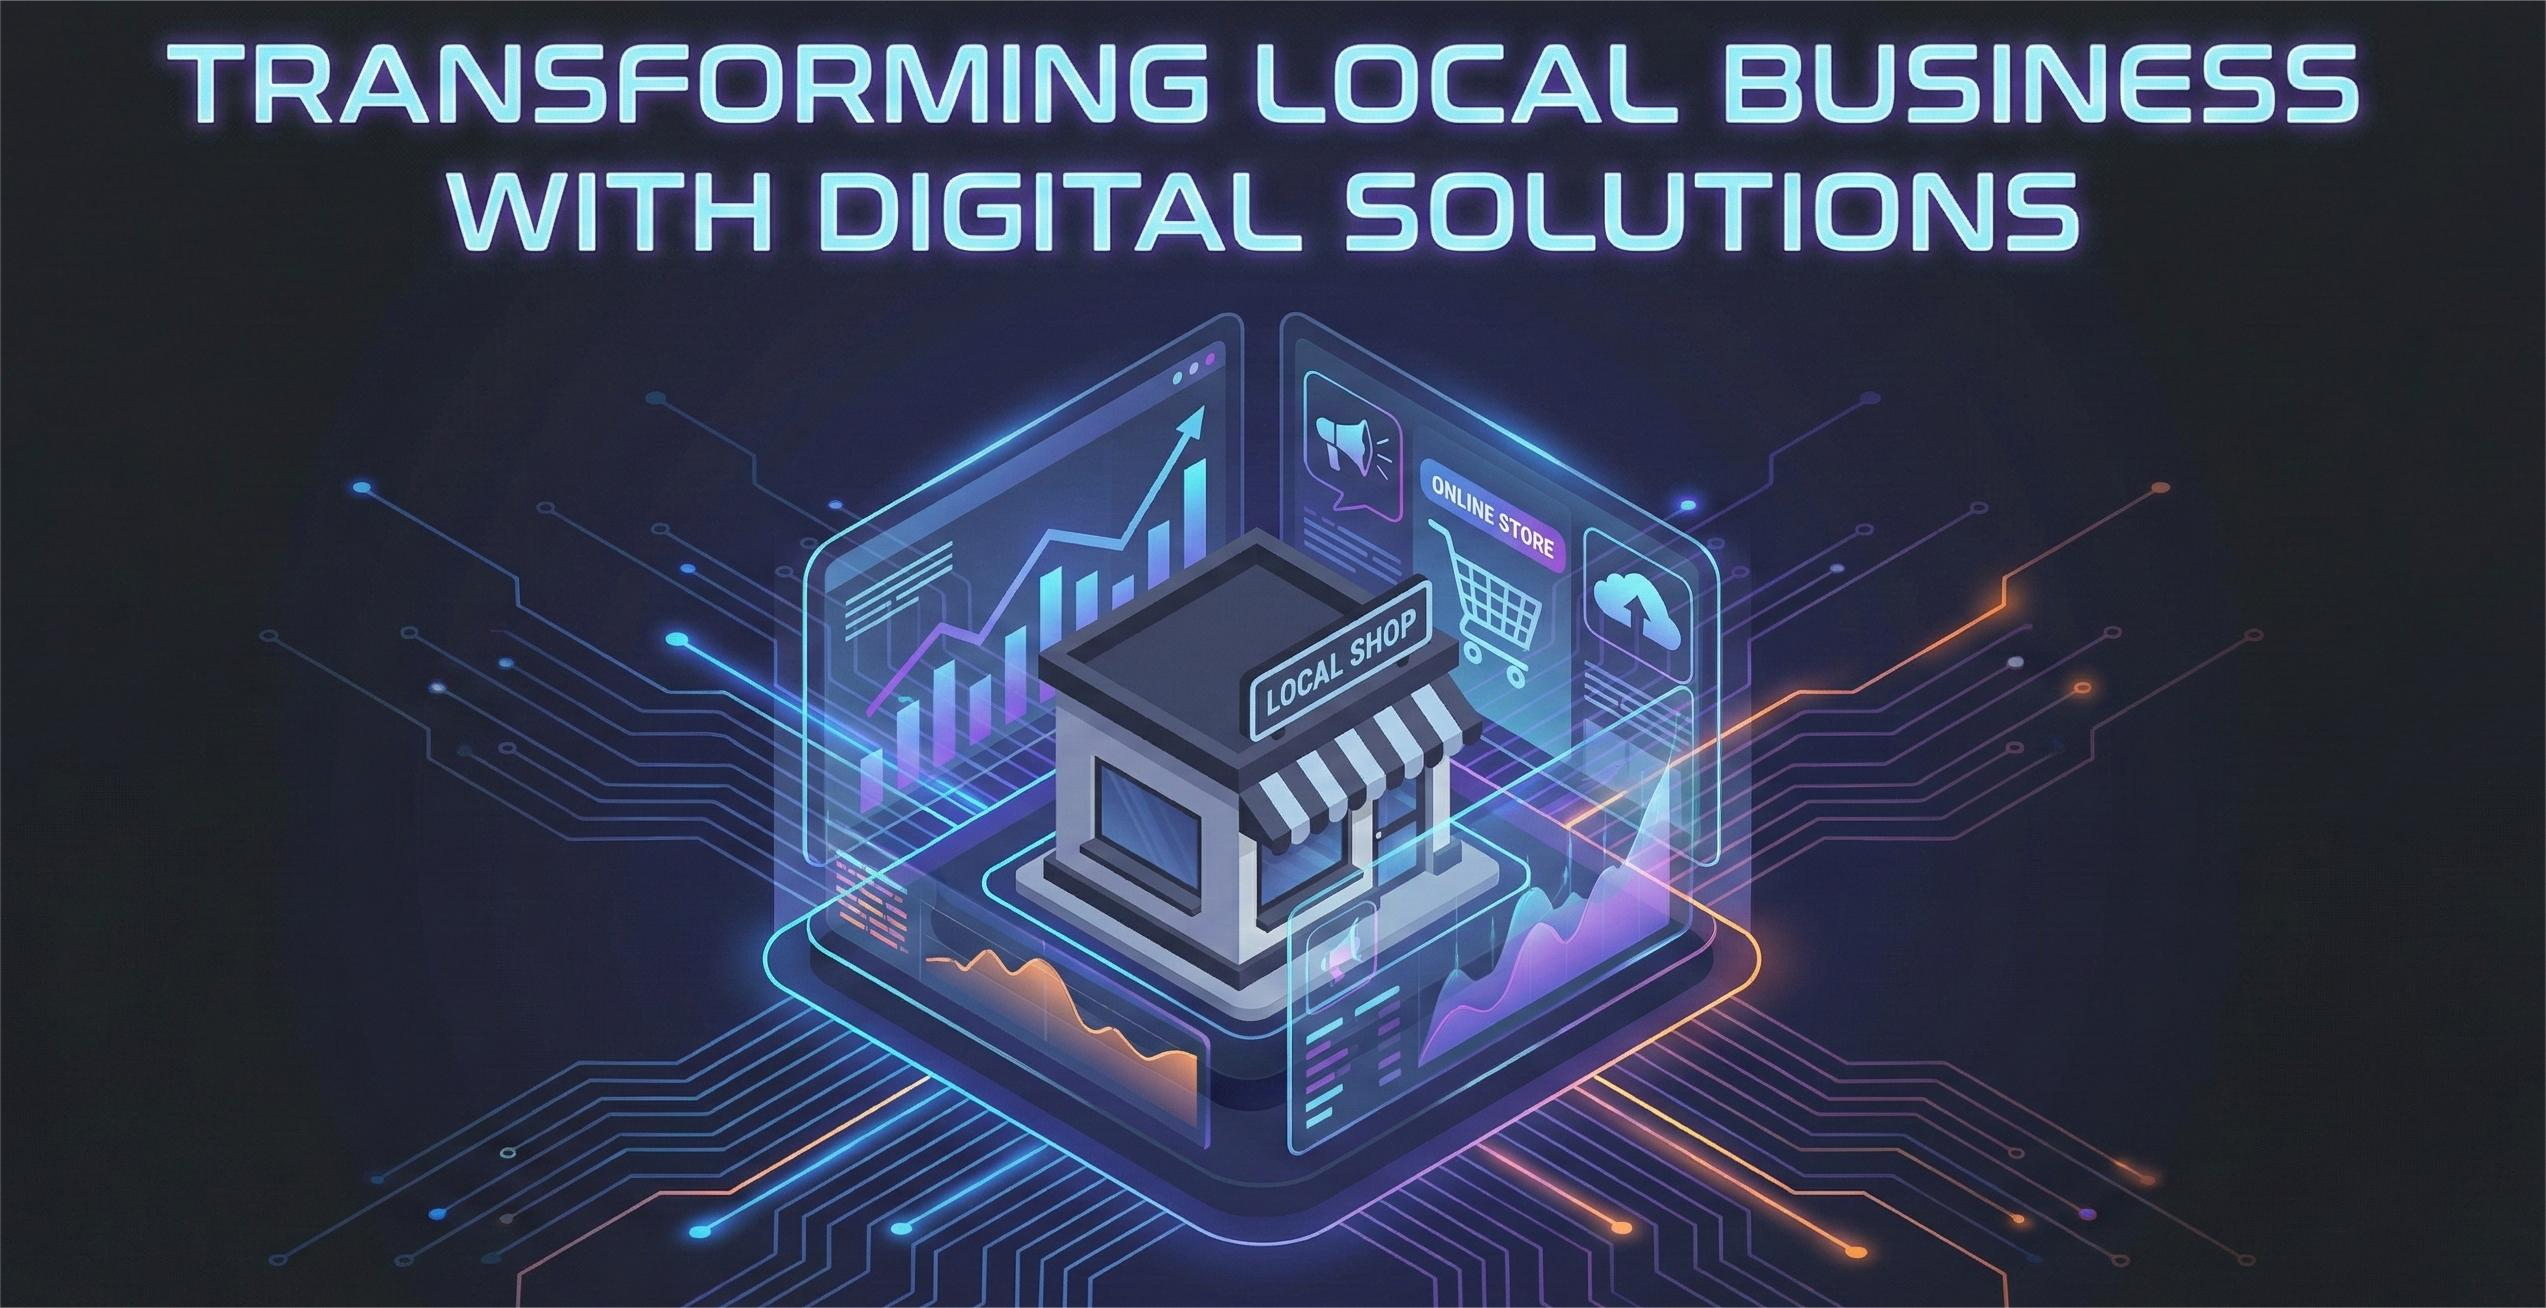
A local retail business was struggling to compete with larger online retailers. This case study showcases how strategic digital transformation led to remarkable growth.
The Challenge
The business had minimal online presence and was losing customers to competitors with better digital strategies.
Website Development
- Product catalog with search functionality
- Secure payment processing
- Customer account management
- Blog for content marketing
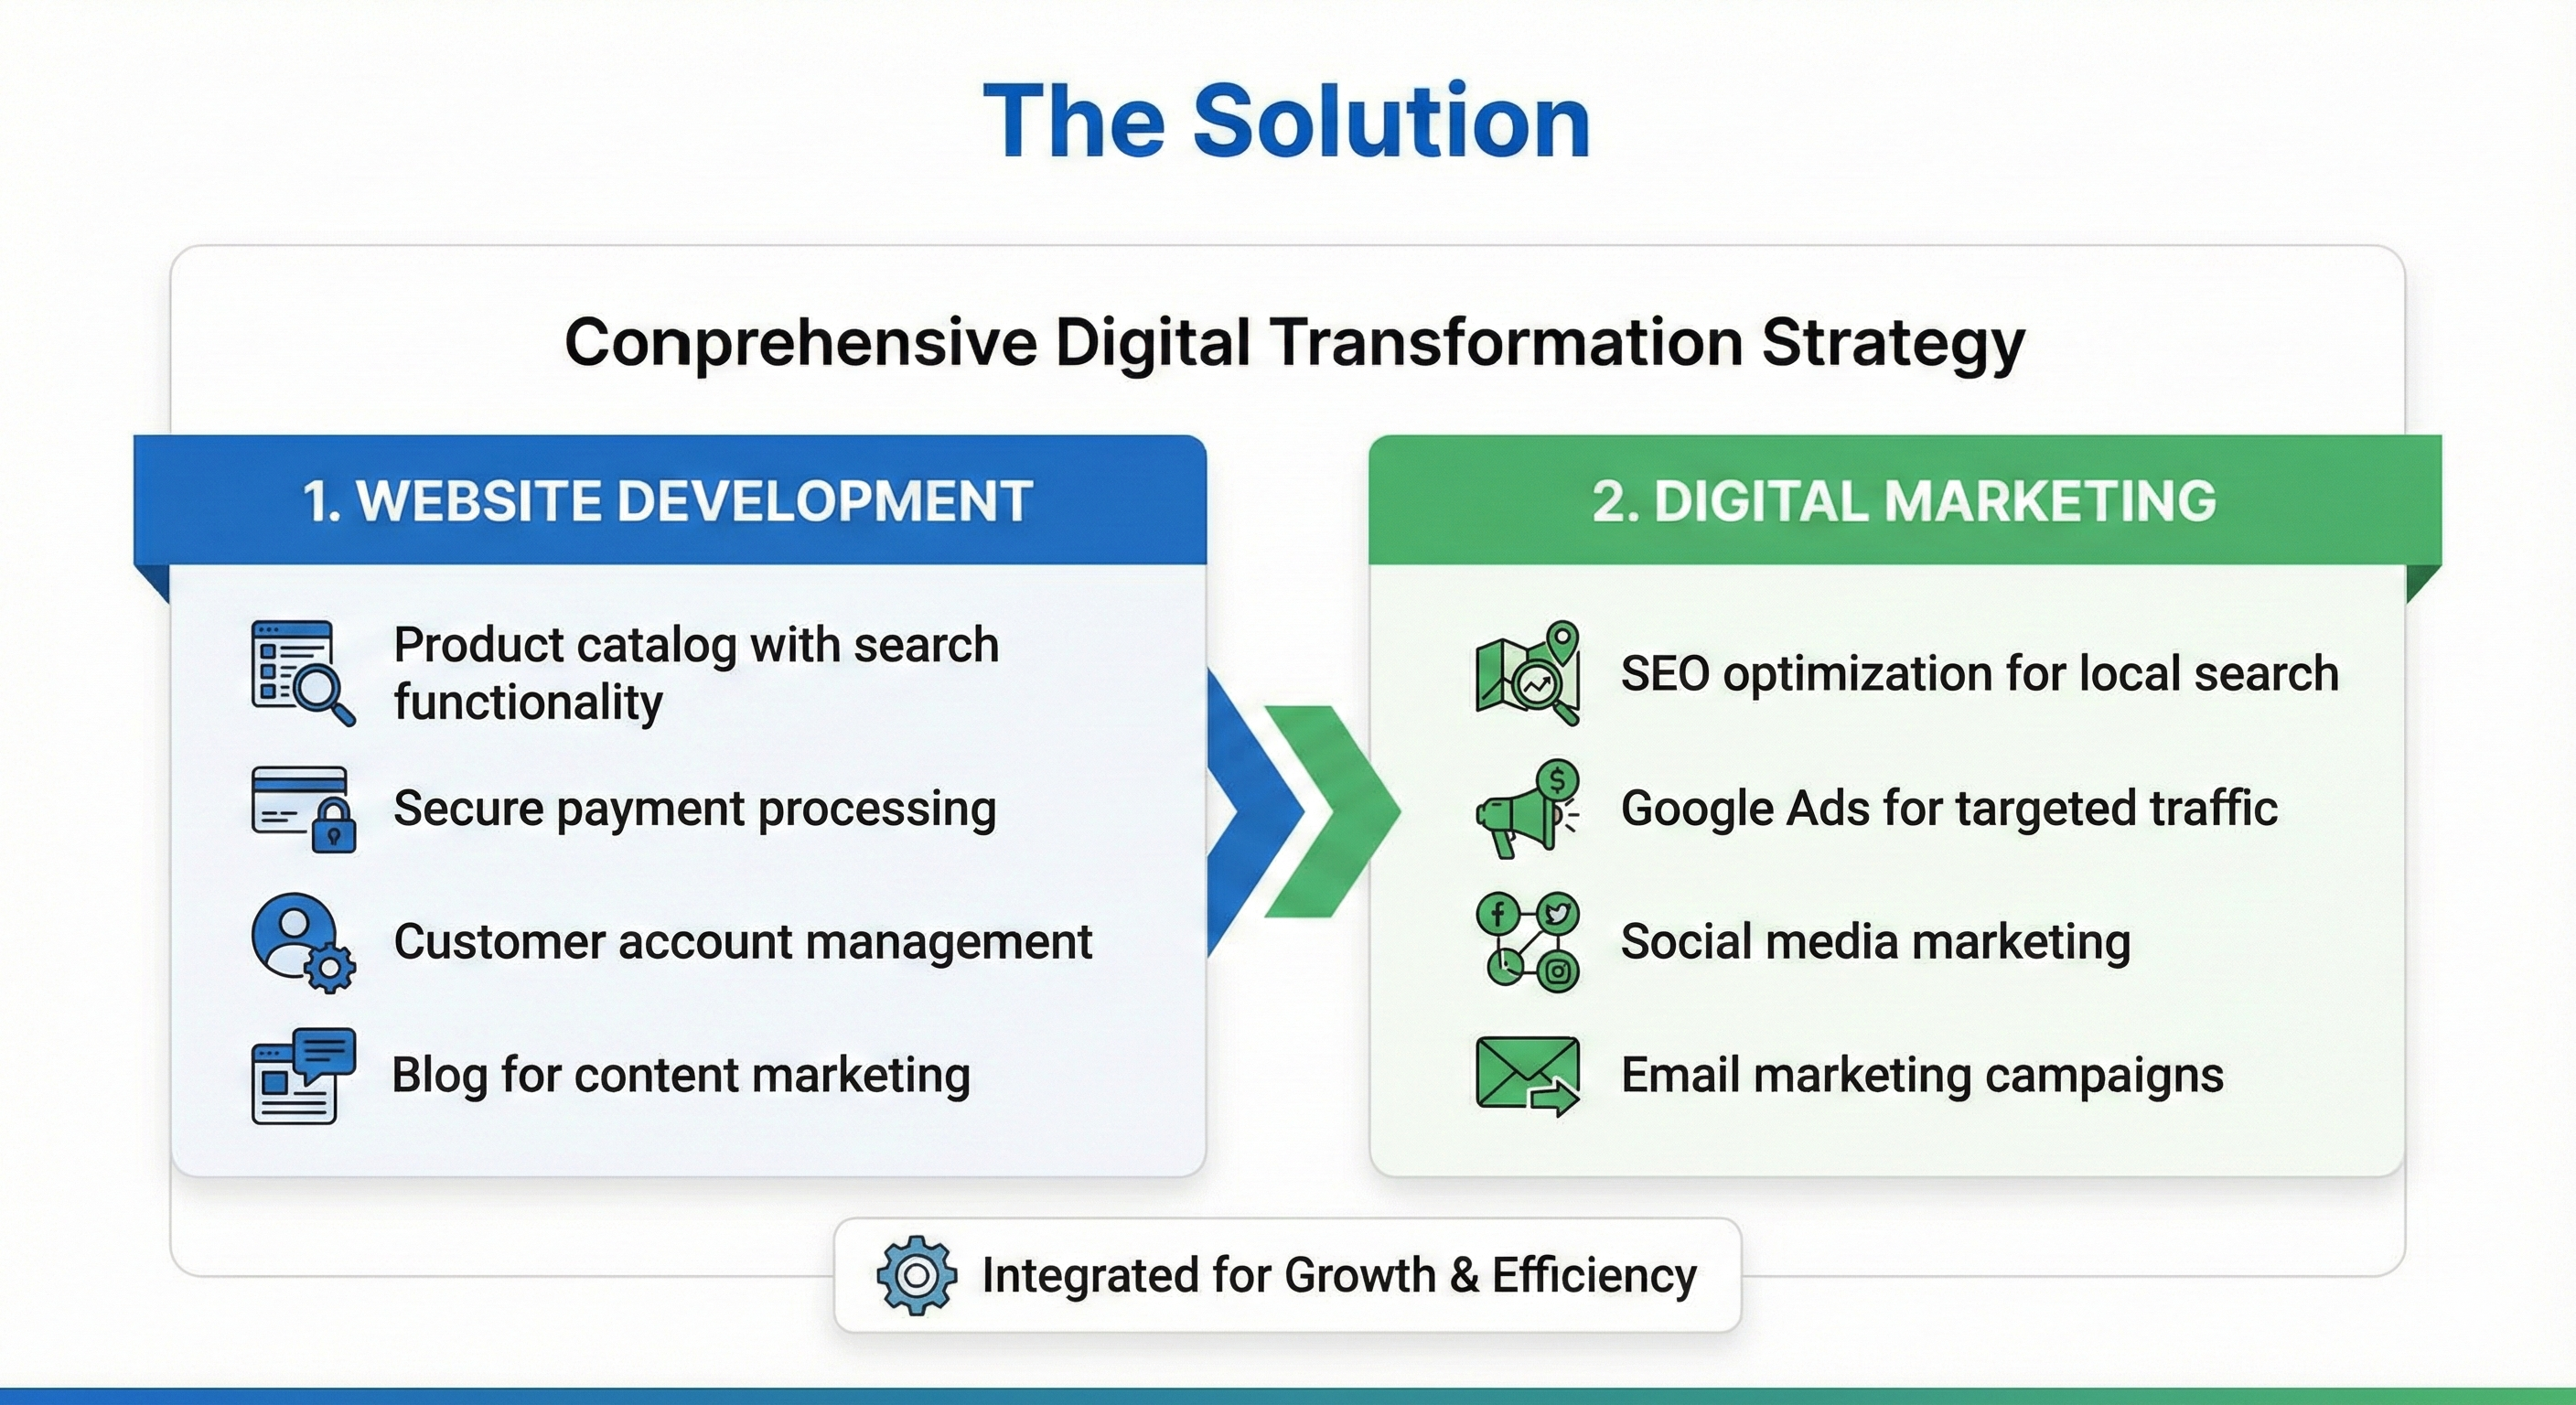
Digital Marketing
- SEO optimization for local search
- Google Ads for targeted traffic
- Social media marketing
- Email marketing campaigns
Results
After 6 months of implementation:
| Online Sales | $5K/mo | $20K/mo | +300% |
|---|---|---|---|
| Website Traffic | 500/mo | 1,250/mo | +150% |
| Customer Retention | 40% | 58% | +45% |
| Acquisition Cost | $80 | $60 | -25% |
Key Takeaways
- Mobile-first approach is essential
- Content marketing builds trust
- Data-driven decisions lead to better results
- Continuous optimization is crucial
// E-commerce tracking setup
gtag('event', 'purchase', {
  transaction_id: 'T12345',
  value: 125.99,
  items: [{ id: 'SKU123', name: 'Product' }]
});
The Problem Landscape
- Invisible Search Presence: A Google search for their primary products yielded only big-box retailers and Amazon links.
- Friction-Heavy Customer Journey: Customers had to call to check stock, leading to a 70% drop-off rate in the consideration phase.
- Data Blindness: The owner had no way of knowing which marketing efforts worked.
- Competitor Encroachment: National brands with optimized local SEO were "stealing" foot traffic from the business’s own backyard.
For a deeper look at how we identify these gaps, explore our Digital Marketing Services.

The Architectural Blueprint
Digital transformation isn't just about building a website; it’s about re-engineering the business logic. At Cinute Infomedia, we believe the foundation must be robust enough to handle the growth we plan to generate.
High-Performance E-commerce Engine
We moved away from "drag-and-drop" builders to a custom-optimized framework.
- Speed as a Feature: Every 100ms delay in load time can drop conversions by 7%. We targeted a sub-2-second load time.
- Mobile-First Indexing: 82% of local searches happen on mobile. Our UI/UX was designed for "thumb-friendly" navigation.
- Secure Payment Gateways: Integrating multi-layer encryption to build consumer trust.
Explore our technical approach here: Web Development Services.

The Multi-Channel Growth Strategy
Once the "storefront" (the website) was ready, we needed to build the "roads" leading to it.
Local SEO: Dominating the Map Pack
We didn't just target global keywords; we dominated "near me" searches.
- GMB Optimization: We optimized the Google My Business profile with high-res photos and automated review prompts.
- Hyper-Local Backlinking: Partnering with local community blogs to establish authority.
Content Marketing: Building the "Trust Factor"
We shifted the blog from a self-promotional tool to a resource center. By answering customer pain points, we positioned the brand as an industry expert.
Learn more about our Search Engine Optimization strategies.

Data-Driven Optimization (The "Secret Sauce")
The transformation didn't stop at launch. We implemented a "Recursive Growth Loop" using advanced analytics.
Precision Tracking
We utilized Google Tag Manager and custom JavaScript events to track more than just sales. We tracked:
- Add-to-cart abandoned rates (to optimize checkout UX).
- Heatmaps (to see where users were getting confused).
- Attribution modeling (to see if a Facebook ad led to a Google search purchase).
JavaScript
// Advanced tracking for user interaction gtag('event', 'view_item_list', { item_list_id: "related_products", item_list_name: "Related Products", items: [ { item_id: "SKU_456", item_name: "Premium Retail Widget", price: 49.99 } ] });
Conversion Rate Optimization (CRO)
Through A/B testing, we discovered that changing the "Buy Now" button color to a specific shade of orange and adding a "Free Shipping over $50" banner increased conversions by 14%.
Check out how we handle complex data: Software Development Services.

The Human Element-Social Media & Email
Automation is powerful, but personalization wins. We integrated an Email Service Provider (ESP) to segment customers based on their buying habits.
- The "Welcome" Series: High-value coupons for first-time visitors.
- The "Win-Back" Series: Automated emails to customers who hadn't purchased in 60 days.
- Social Proof: We curated User-Generated Content (UGC) from Instagram to display on the product pages
Deep-Dive Analysis of the Results
Metric
Pre-Transformation
Post-Transformation (6 Months)
Growth %
Monthly Online Revenue
$5,000
$22,400
+348%
Organic Monthly Traffic
500 visitors
1,850 visitors
+270%
Avg. Order Value (AOV)
$45.00
$68.50
+52%
Customer Acquisition Cost
$80.00
$55.00
-31%
Cart Abandonment Rate
85%
62%
-27%
The "Snowball Effect" of Digital Equity
One of the most significant-yet intangible-results was the increase in Brand Equity. The business moved from being a "commodity" shop to a "destination" brand. The 200% increase in local SEO traffic meant that even when people didn't buy online, they were walking into the physical store with their phones in hand, pointing at the website.

Technical Insights for Small Businesses
If you are a business owner reading this, the scale of "Digital Transformation" might seem daunting. However, it follows a logical $y = mx + b$ progression where $y$ is your growth, and the variables are your digital assets.
- Own Your Data: Do not rely solely on third-party platforms like Facebook or Amazon. Your website is the only digital real estate you truly own.
- Infrastructure Matters: A slow website is like a store with a locked door. Invest in quality hosting and clean code.
- The Feedback Loop: Use your "Contact Us" forms and reviews as a product development roadmap.
The Road Ahead: Scaling to 500%
The transformation is never truly "finished." As we move into the next phase of our partnership with this client, we are looking at:
- AI Chatbots: To provide 24/7 customer support.
- Predictive Inventory: Using historical data to stock up before peak seasons.
- Augmented Reality (AR): Allowing customers to visualize products in their homes before buying.

Conclusion
The success of this local retail business serves as a blueprint for the modern economy. Digital transformation is no longer a luxury for the "big players"-it is the survival kit for the local hero. By combining technical expertise with Cinute Infomedia's strategic vision, we turned a struggling shop into a regional powerhouse.
Are you ready to break through your digital ceiling?
Let’s Build Your Success Story Together. Would you like me to perform a free digital audit of your current website to identify where you're losing potential revenue?
Visit us at Cinute Infomedia to explore more case studies.
Related Articles
Lead Qualifier Chat Flows: The Complete Guide to AI-Powered Lead Qualification (2026)
Lead qualifier chat flows use AI-powered chatbots to automatically screen, score, and segment your website visitors so your sales team only speaks to prospects who are genuinely ready to buy. This guide covers everything from BANT frameworks to CRM integrations and live chat flow examples.

Security Plugins Hardening: The Definitive Website Protection Guide
Simply installing a security plugin will not protect your website if you leave default settings active. Learn how to configure advanced hardening features to safeguard your data, protect user privacy, and prevent unauthorized core file access.

E-commerce Packaging Design: Turning the Unboxing Moment Into Brand Loyalty
Discover how to transform your e-commerce packaging from a simple shipping expense into a powerful customer retention tool. Learn the anatomy of high-converting boxes, the choreography of a memorable unboxing experience, and a sustainable, step-by-step design process that turns first-time buyers into lifelong brand advocates.